OVERVIEW
Interactive maps for ABCNews
A dynamic interactive map designed to track major real-time events. The map was intended to be scalable across Disney's major brands.
Highest active users online in ABCNews history.
Responsive web
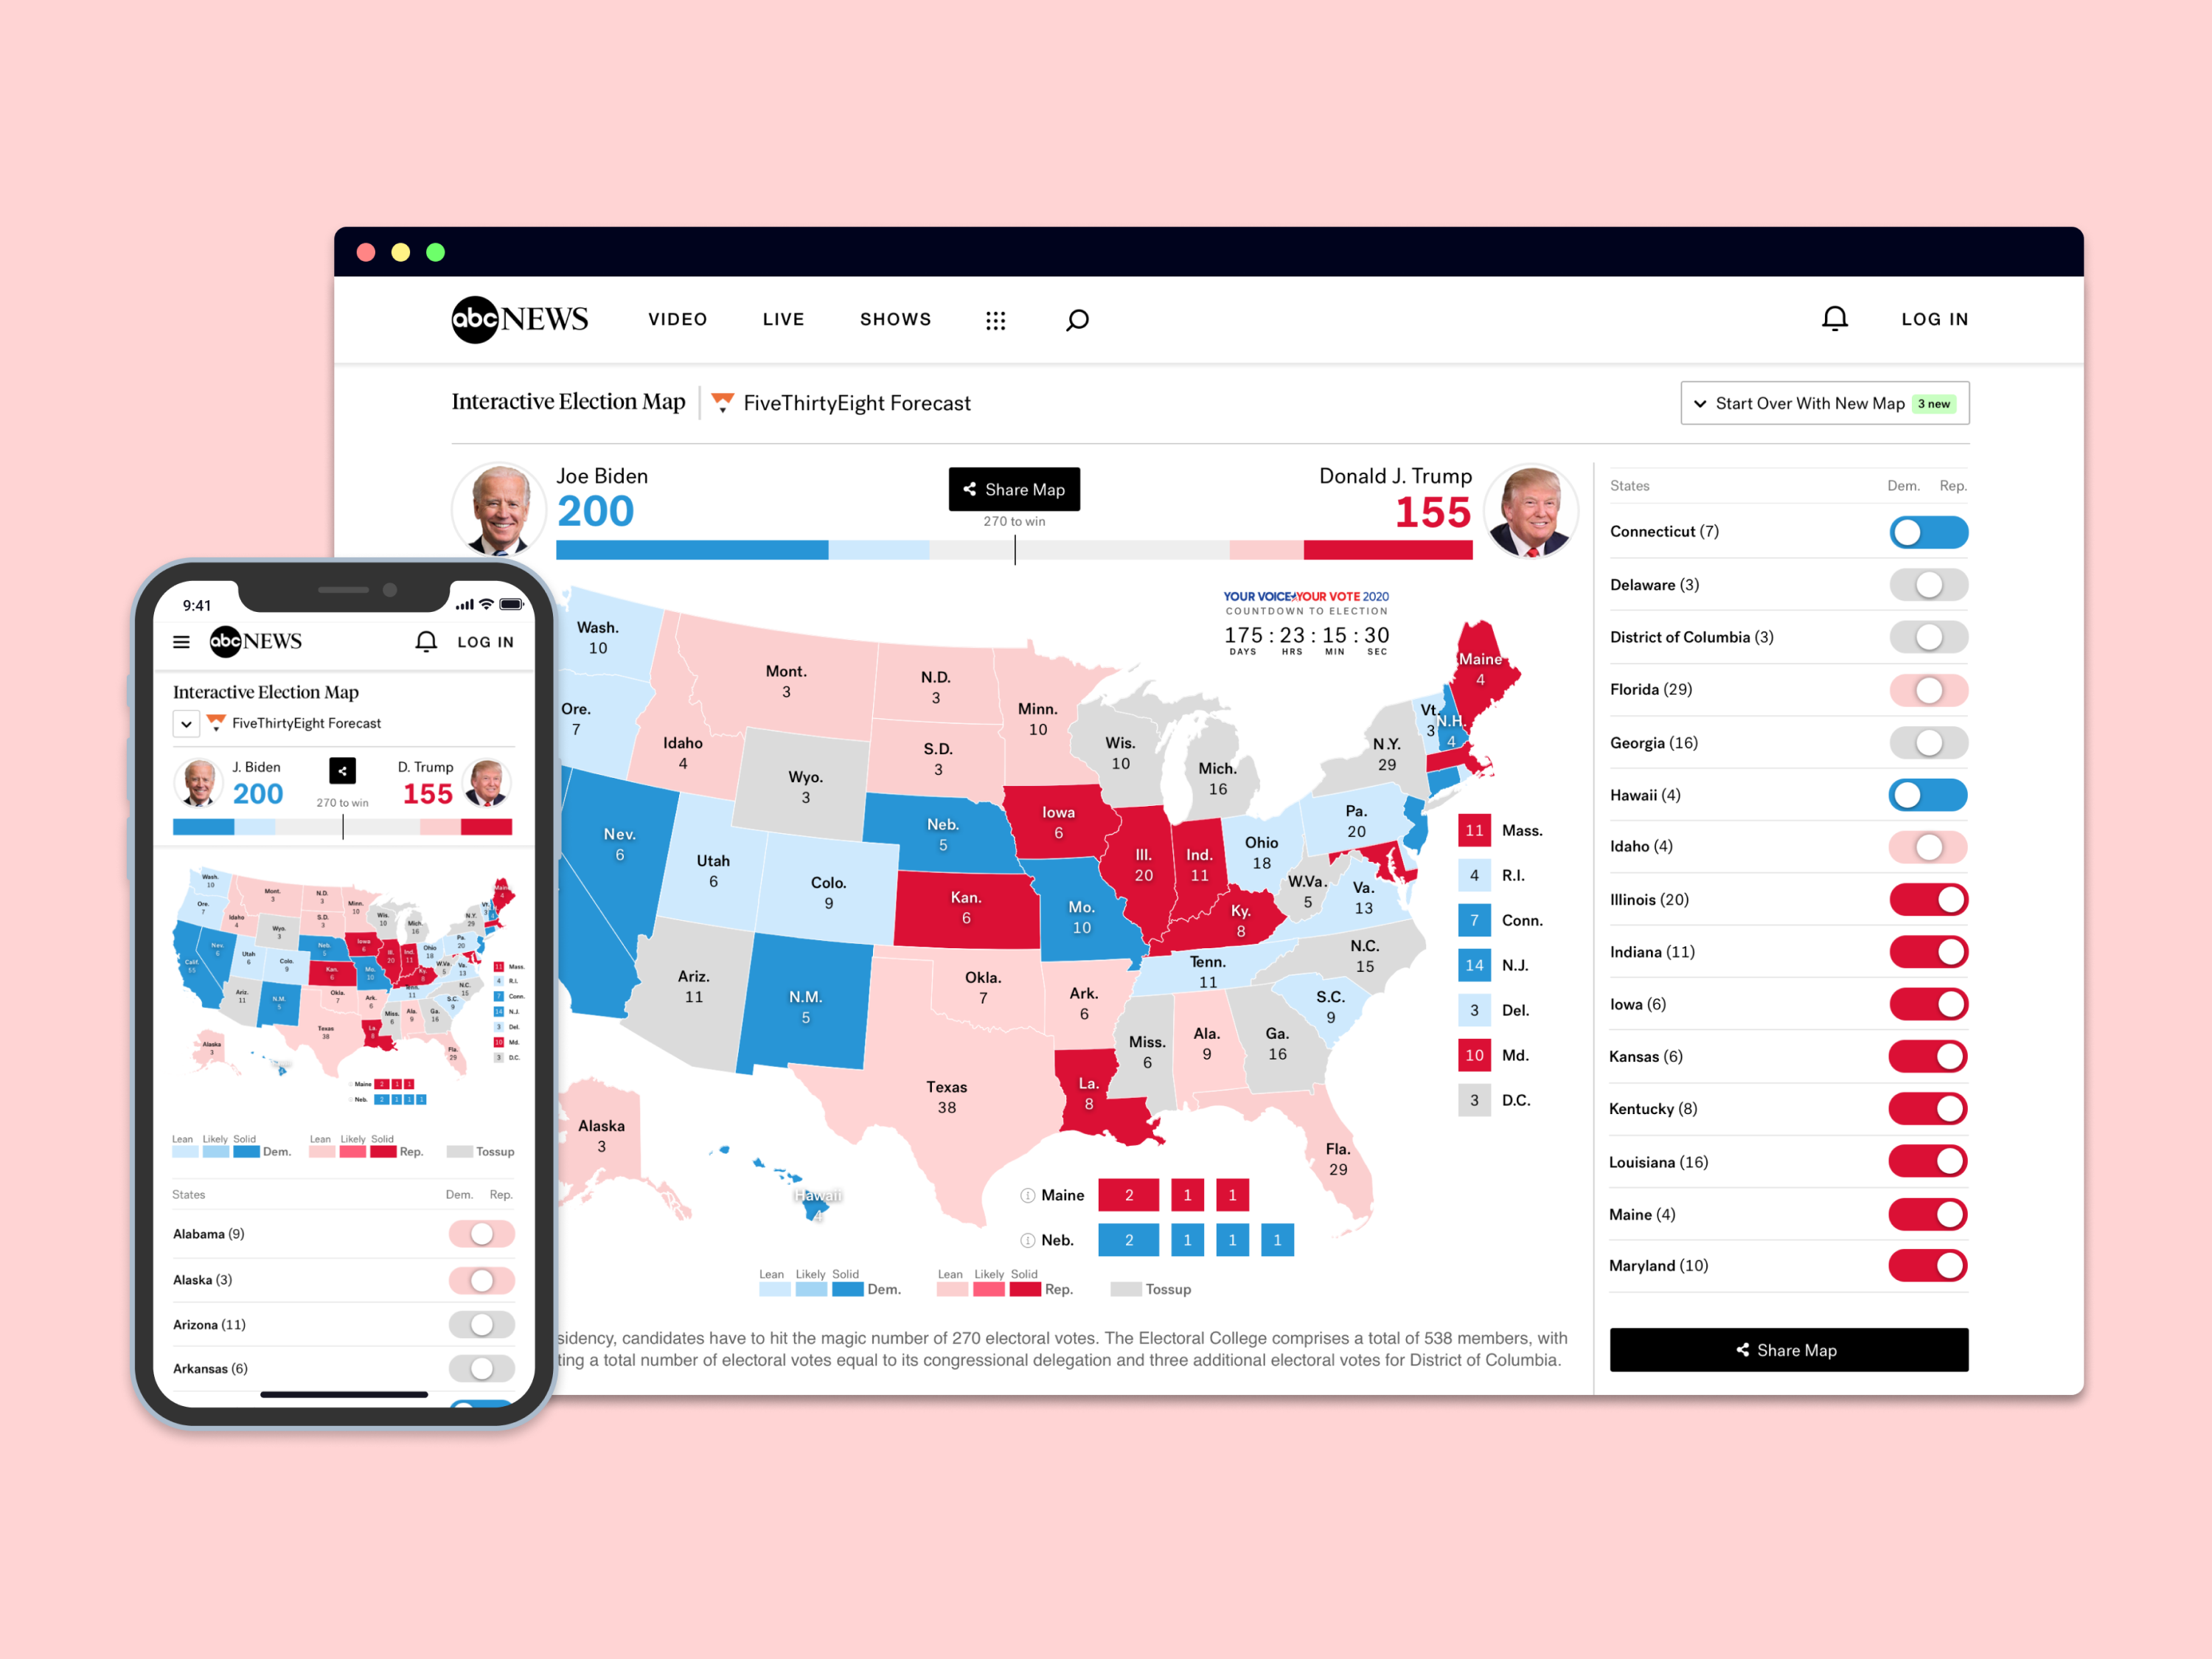
In 2020, I led the design of Disney's dynamic real-time events map platform, a scalable solution later adopted across multiple brands. The platform powered high-profile experiences like ABCNews' 2020 Presidential Election Map and the COVID-19 Cases & Vaccination Tracker, engaging millions of users during critical national events.
My challenge was to design an experience that was engaging, familiar, and highly shareable, while also scaling across desktop and mobile.
TIMEFRAME
Q1 2020 - Q2 2020
ROLE
Design Lead
TEAM
Product Manager, Team Lead, Software Engineers
IMPACT
1.5MM+ users online
This project consists of three various usage of the map. You can jump directly to any of them.
CHALLENGE
How do you make real-time election data engaging, interactive, and shareble for millions of viewers?
In early 2020, ABCNews needed a new interactive platform for the upcoming Presidential Election. The product had to let users explore, predict, and share their own election outcomes, while working seamlessly across both desktop and mobile.
I collaborated closely with product managers, team lead, and a team of software engineers to define requirements, validate design directions, and ensure scalability for high-traffic national events.
RESEARCH & EXPLORATION
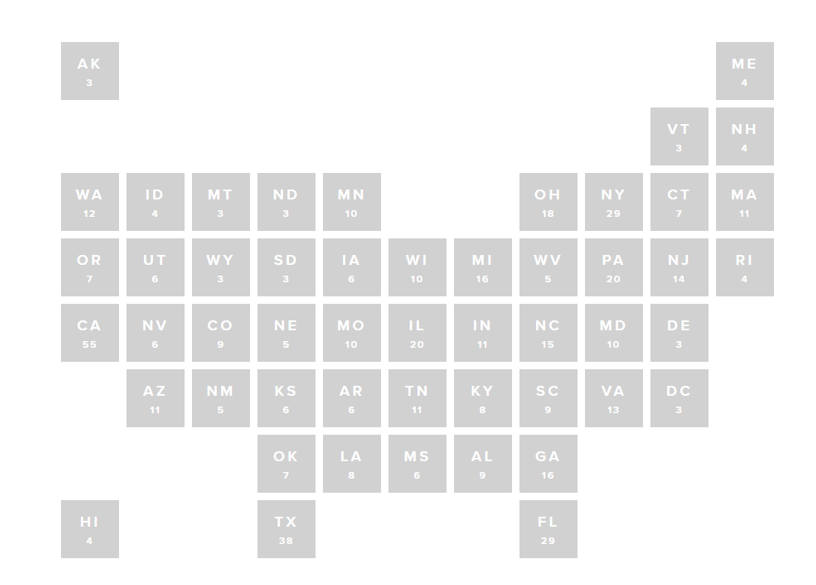
Grid layout
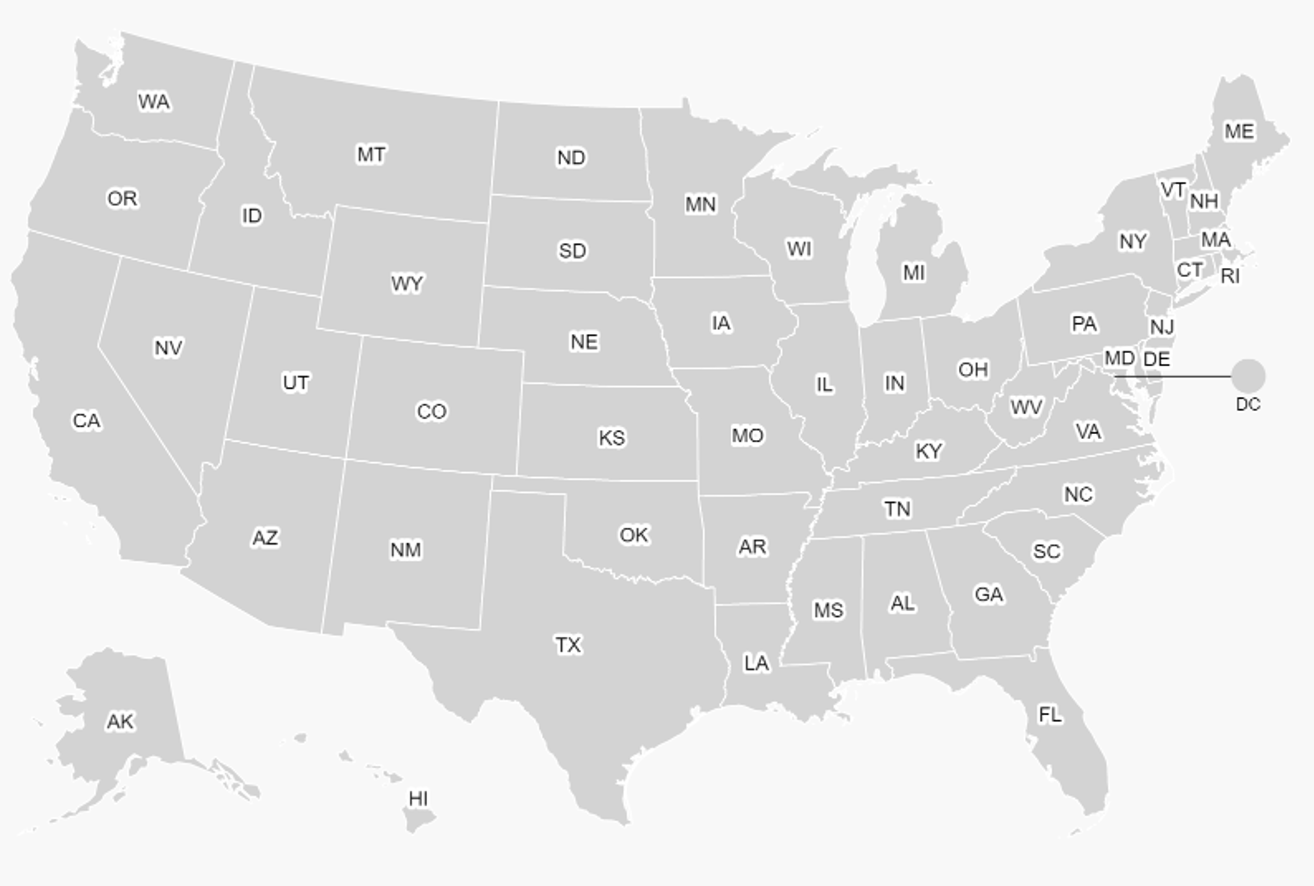
Traditional Map
Hybrid Map
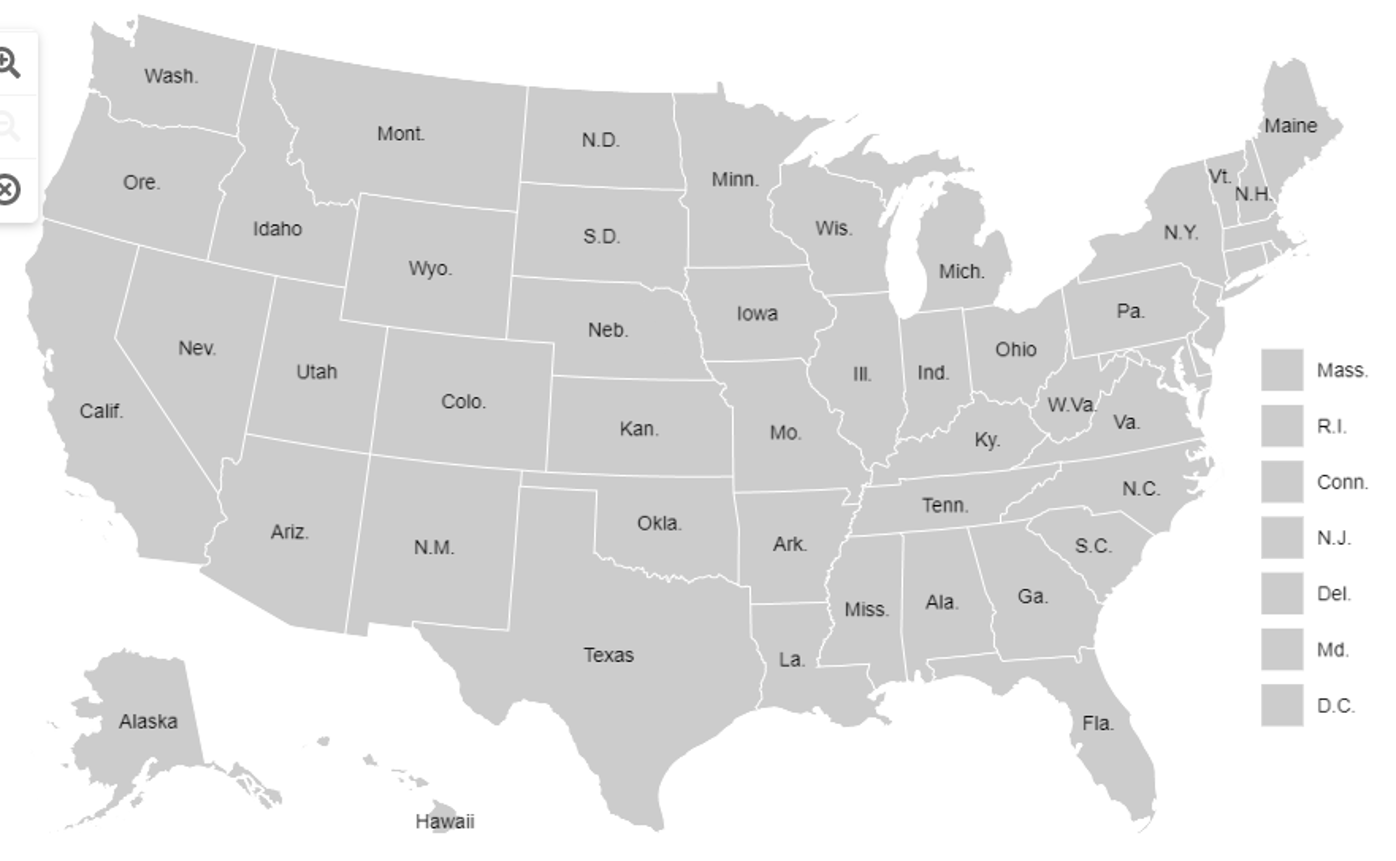
Exploring different approaches to visualizing the U.S. Electoral map:
- Option 1: Grid layout → A box design with state abbreviations. Clear, but unfamiliar to most users.
- Option 2: Traditional Map → Recognizable, but small states like NJ/DE/RI were difficult to tap or click.
- Option 3: Hybrid Design → A mix of traditional layout plus a side list for smaller states, ensuring both usability and familiarity.
Decision: I moved forward with the hybrid map, which combined trustworthiness of the familiar U.S. map with accessibility for small states.
DESIGNING CORE INTERACTIONS
Once the foundation of the map was set, I designed the core interactions that transformed it from a static visualization into an engaging, playful tool. Below are some of the design process.
1. Navigation User Study
Problem:
- Early testing showed that placing the navigation bar at the bottom created confusion. Users simply didn't discover it. Heatmaps confirmed low interaction and engagement.
Solution:
- To improve visibility, we repositioned the navigation above the map, where users naturally looked first. Engagement increased immediately.
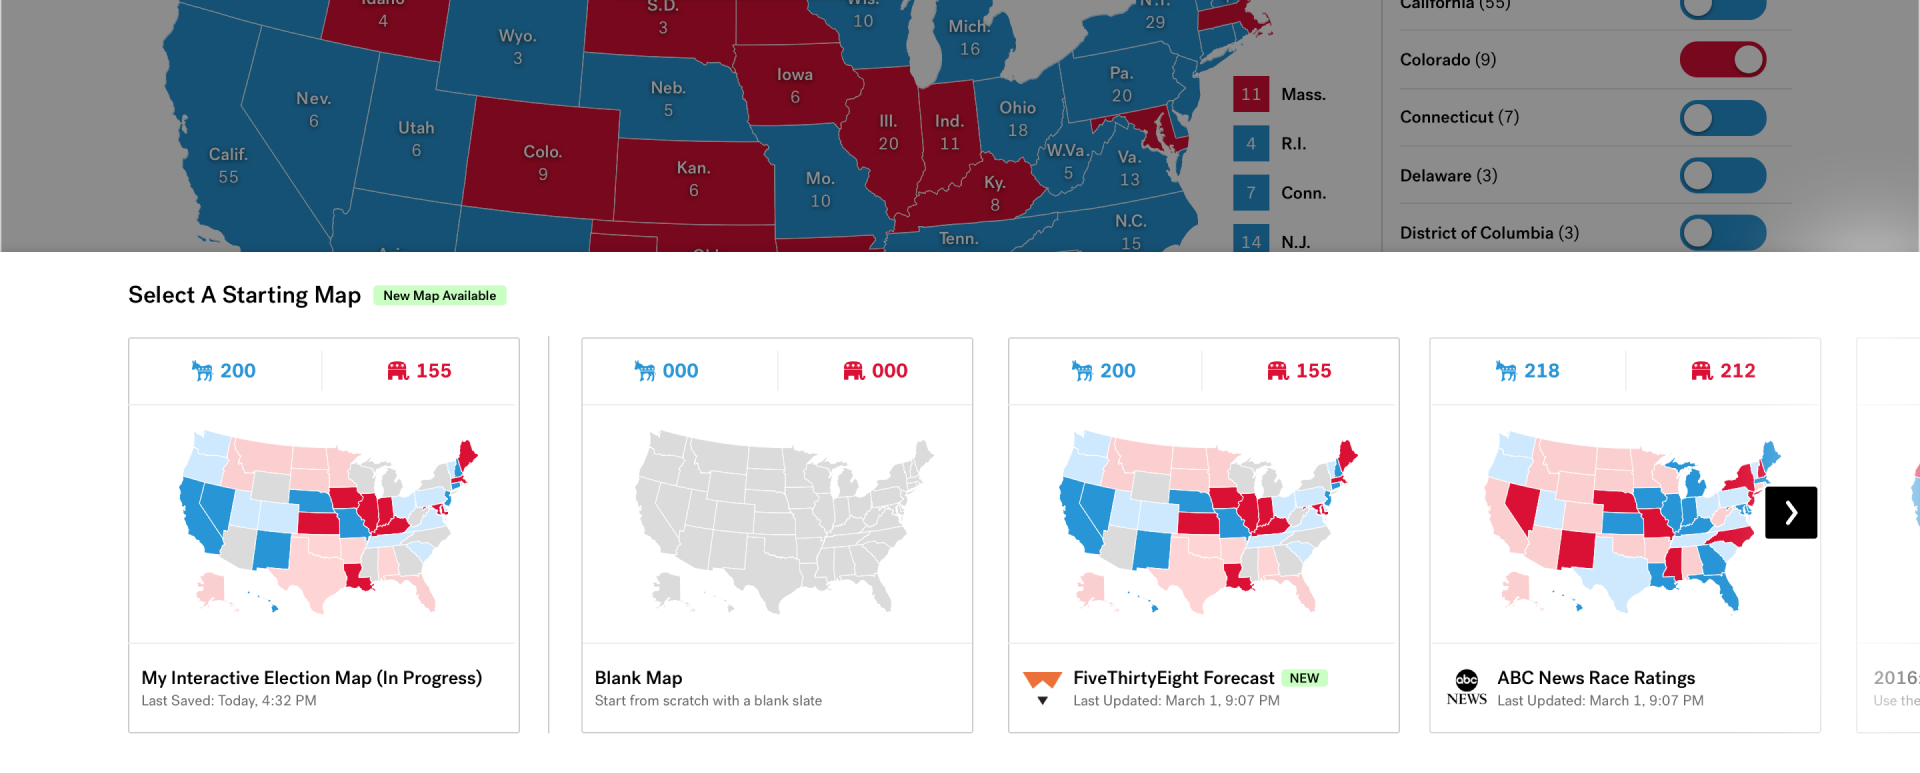
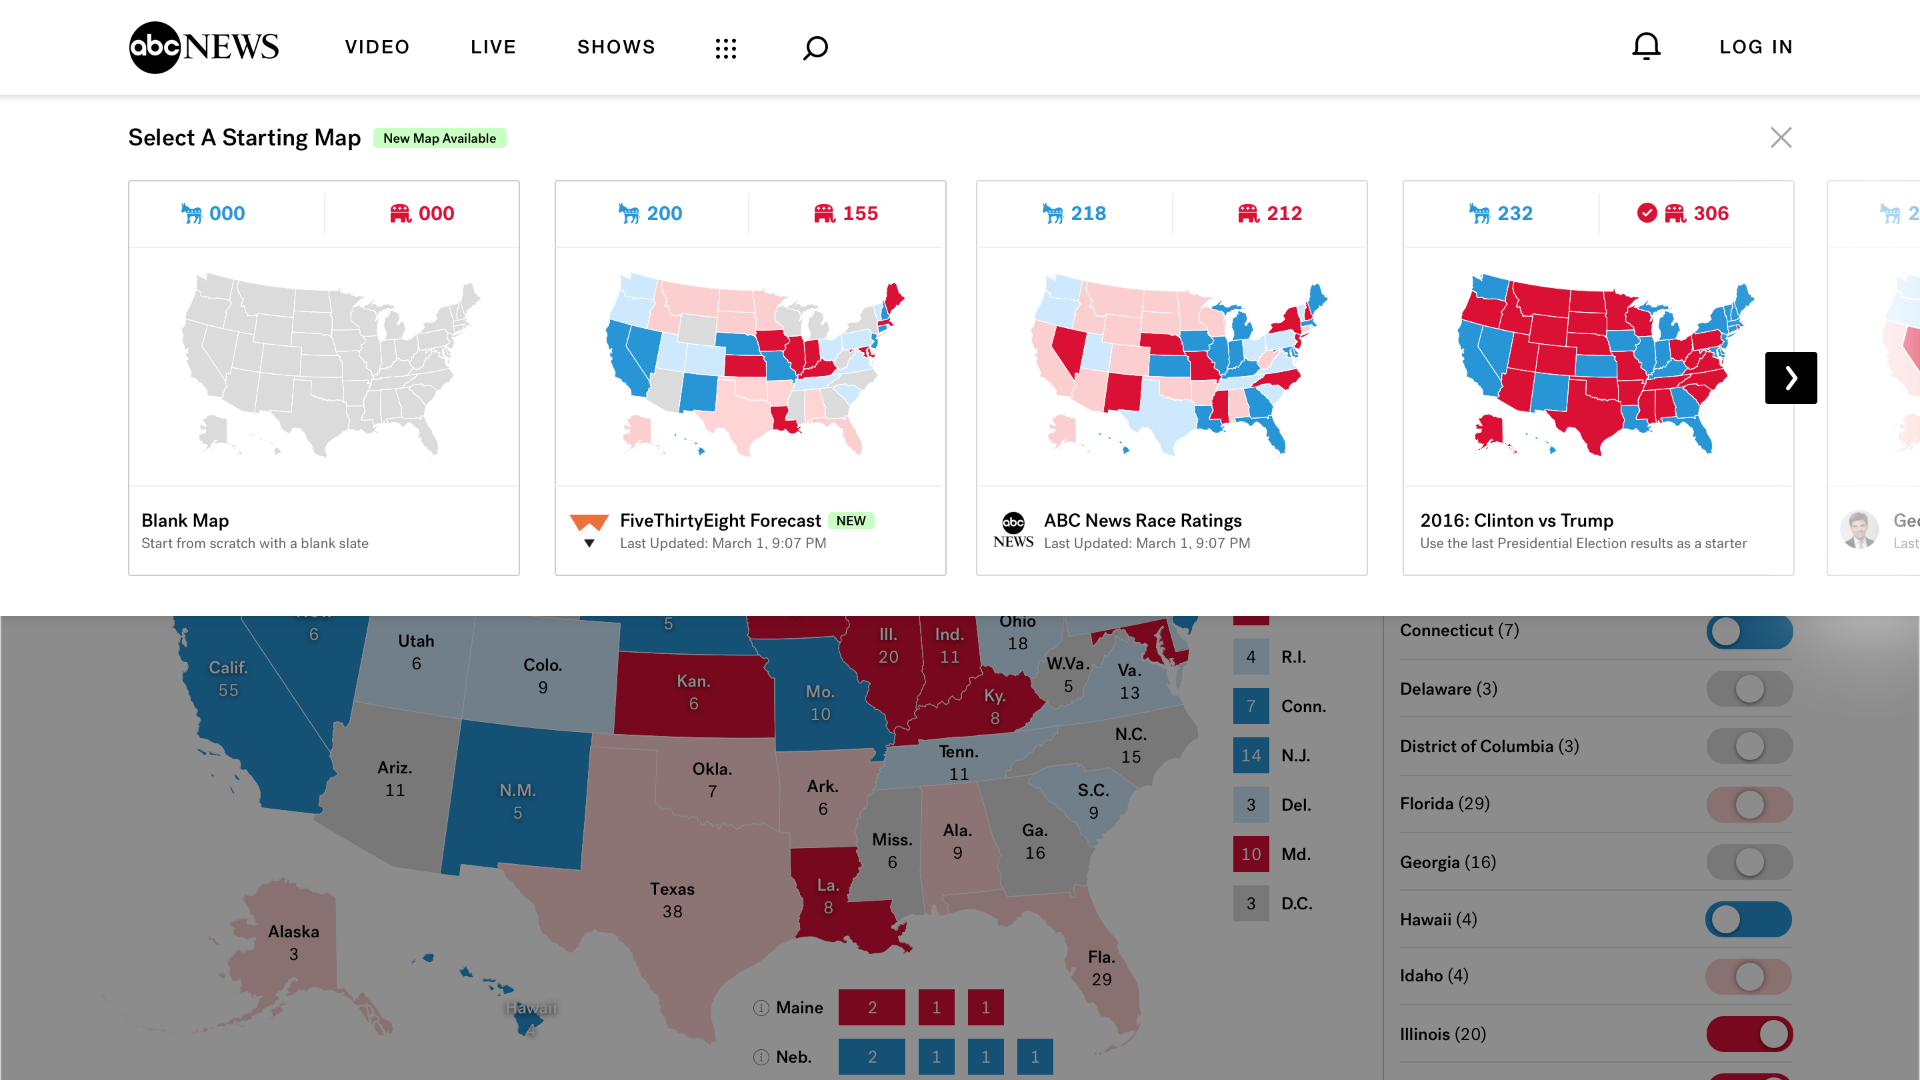
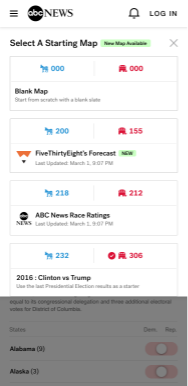
2. Curated Maps Library
Problem:
- Starting with a blank map could overwhelm new users.
Solution:
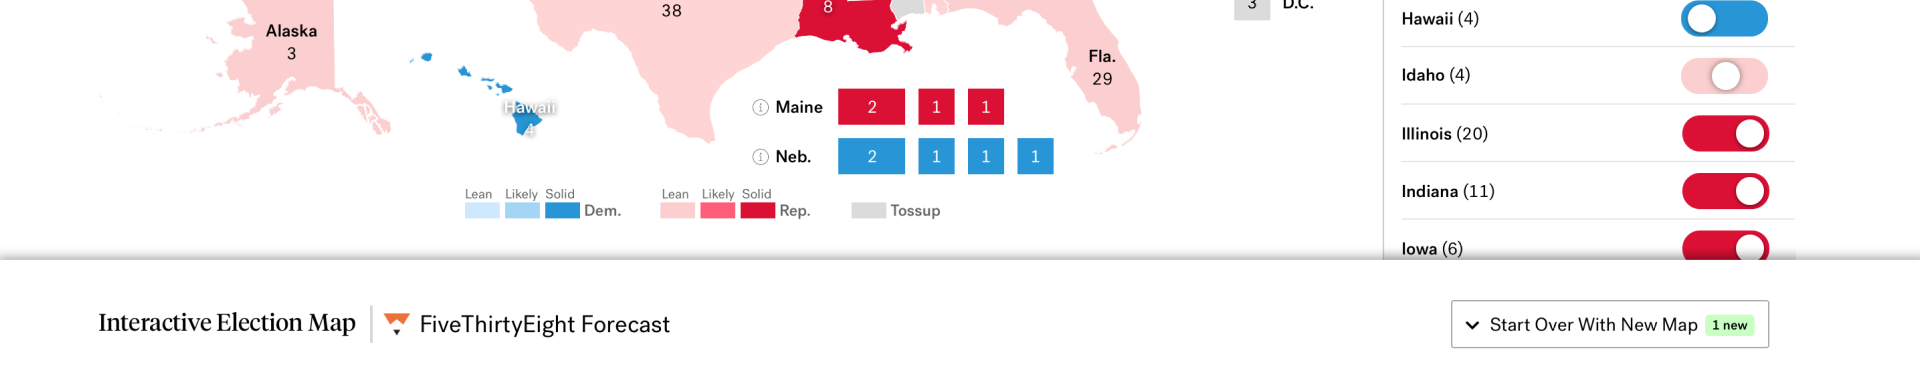
- A library of curated scenarios (previous elections, analyst forecasts, FiveThirtyEight projections, landslide wins, blank map).
- Each card included a preview, Balance of Power summary, and timestamp.
Value:
- Lowered entry barrier, making the experience more approachable and storytelling-driven.
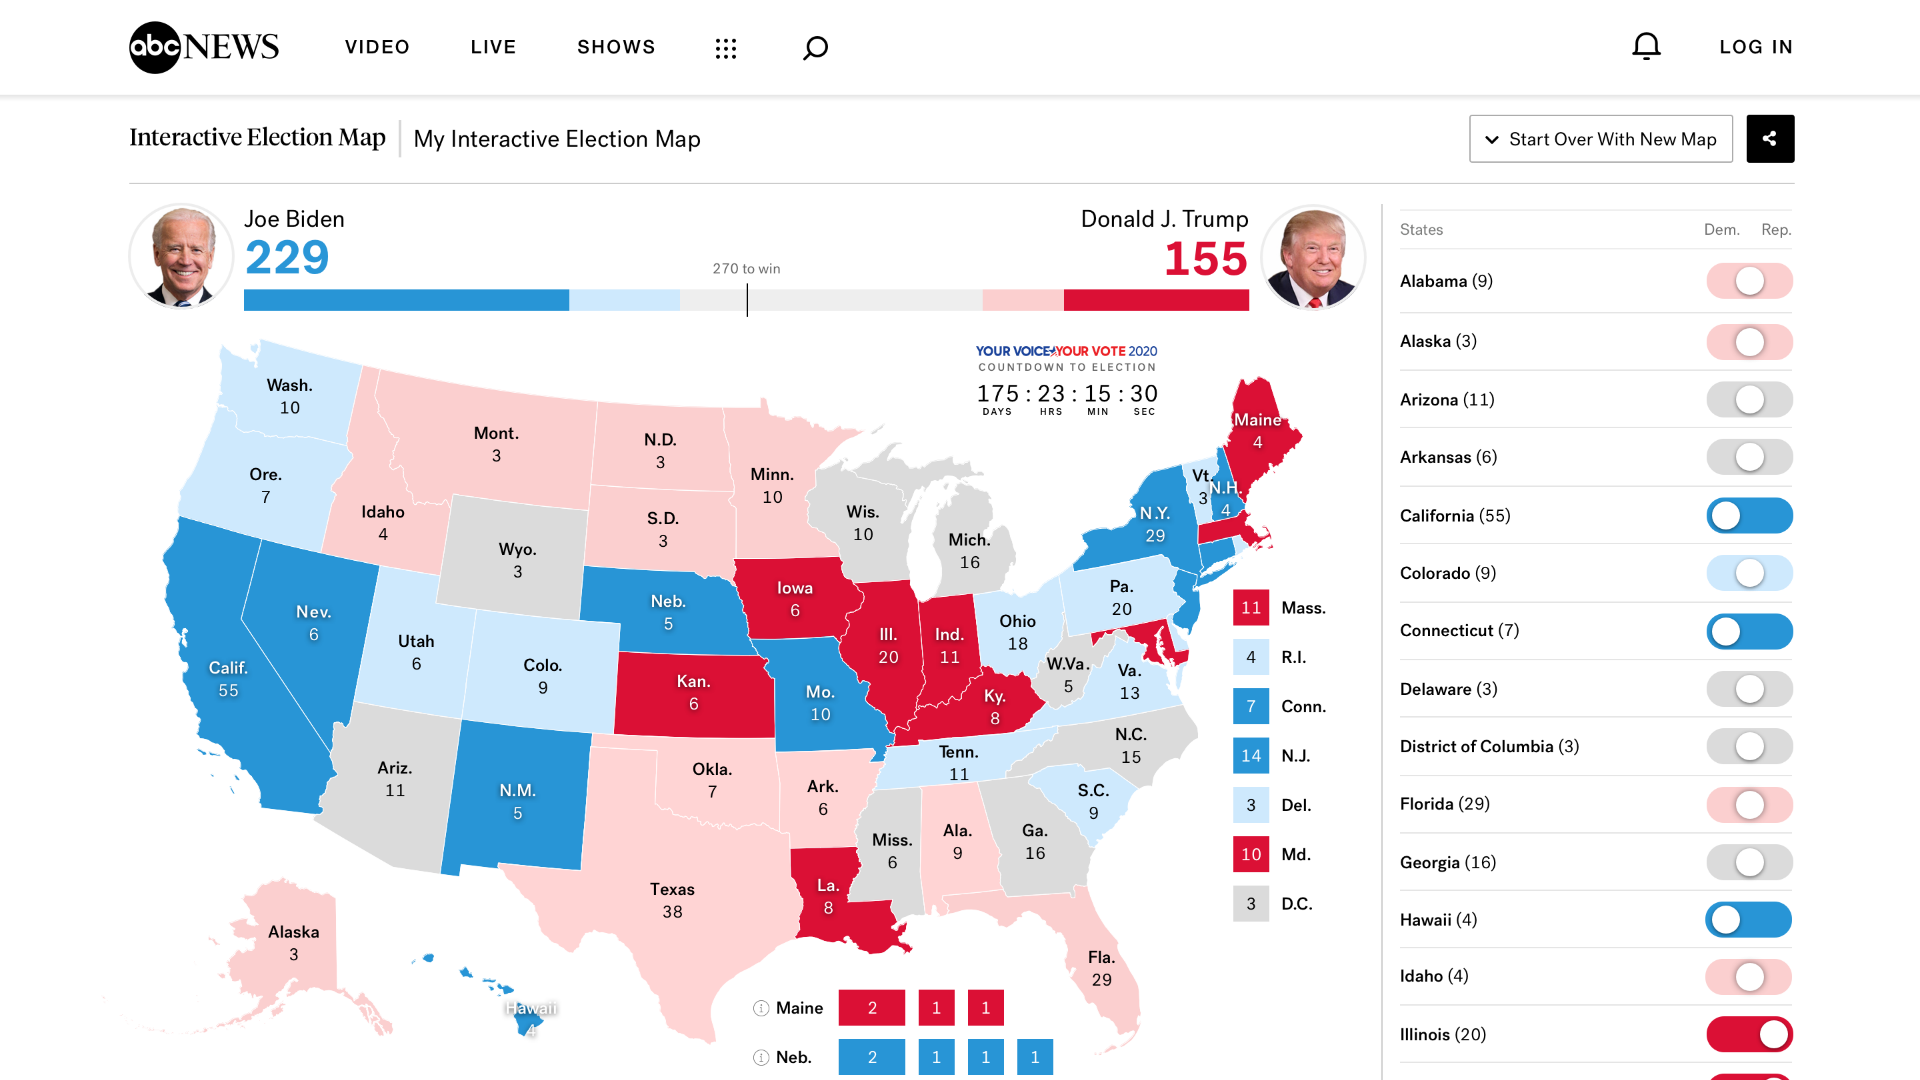
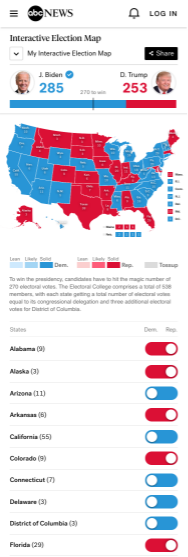
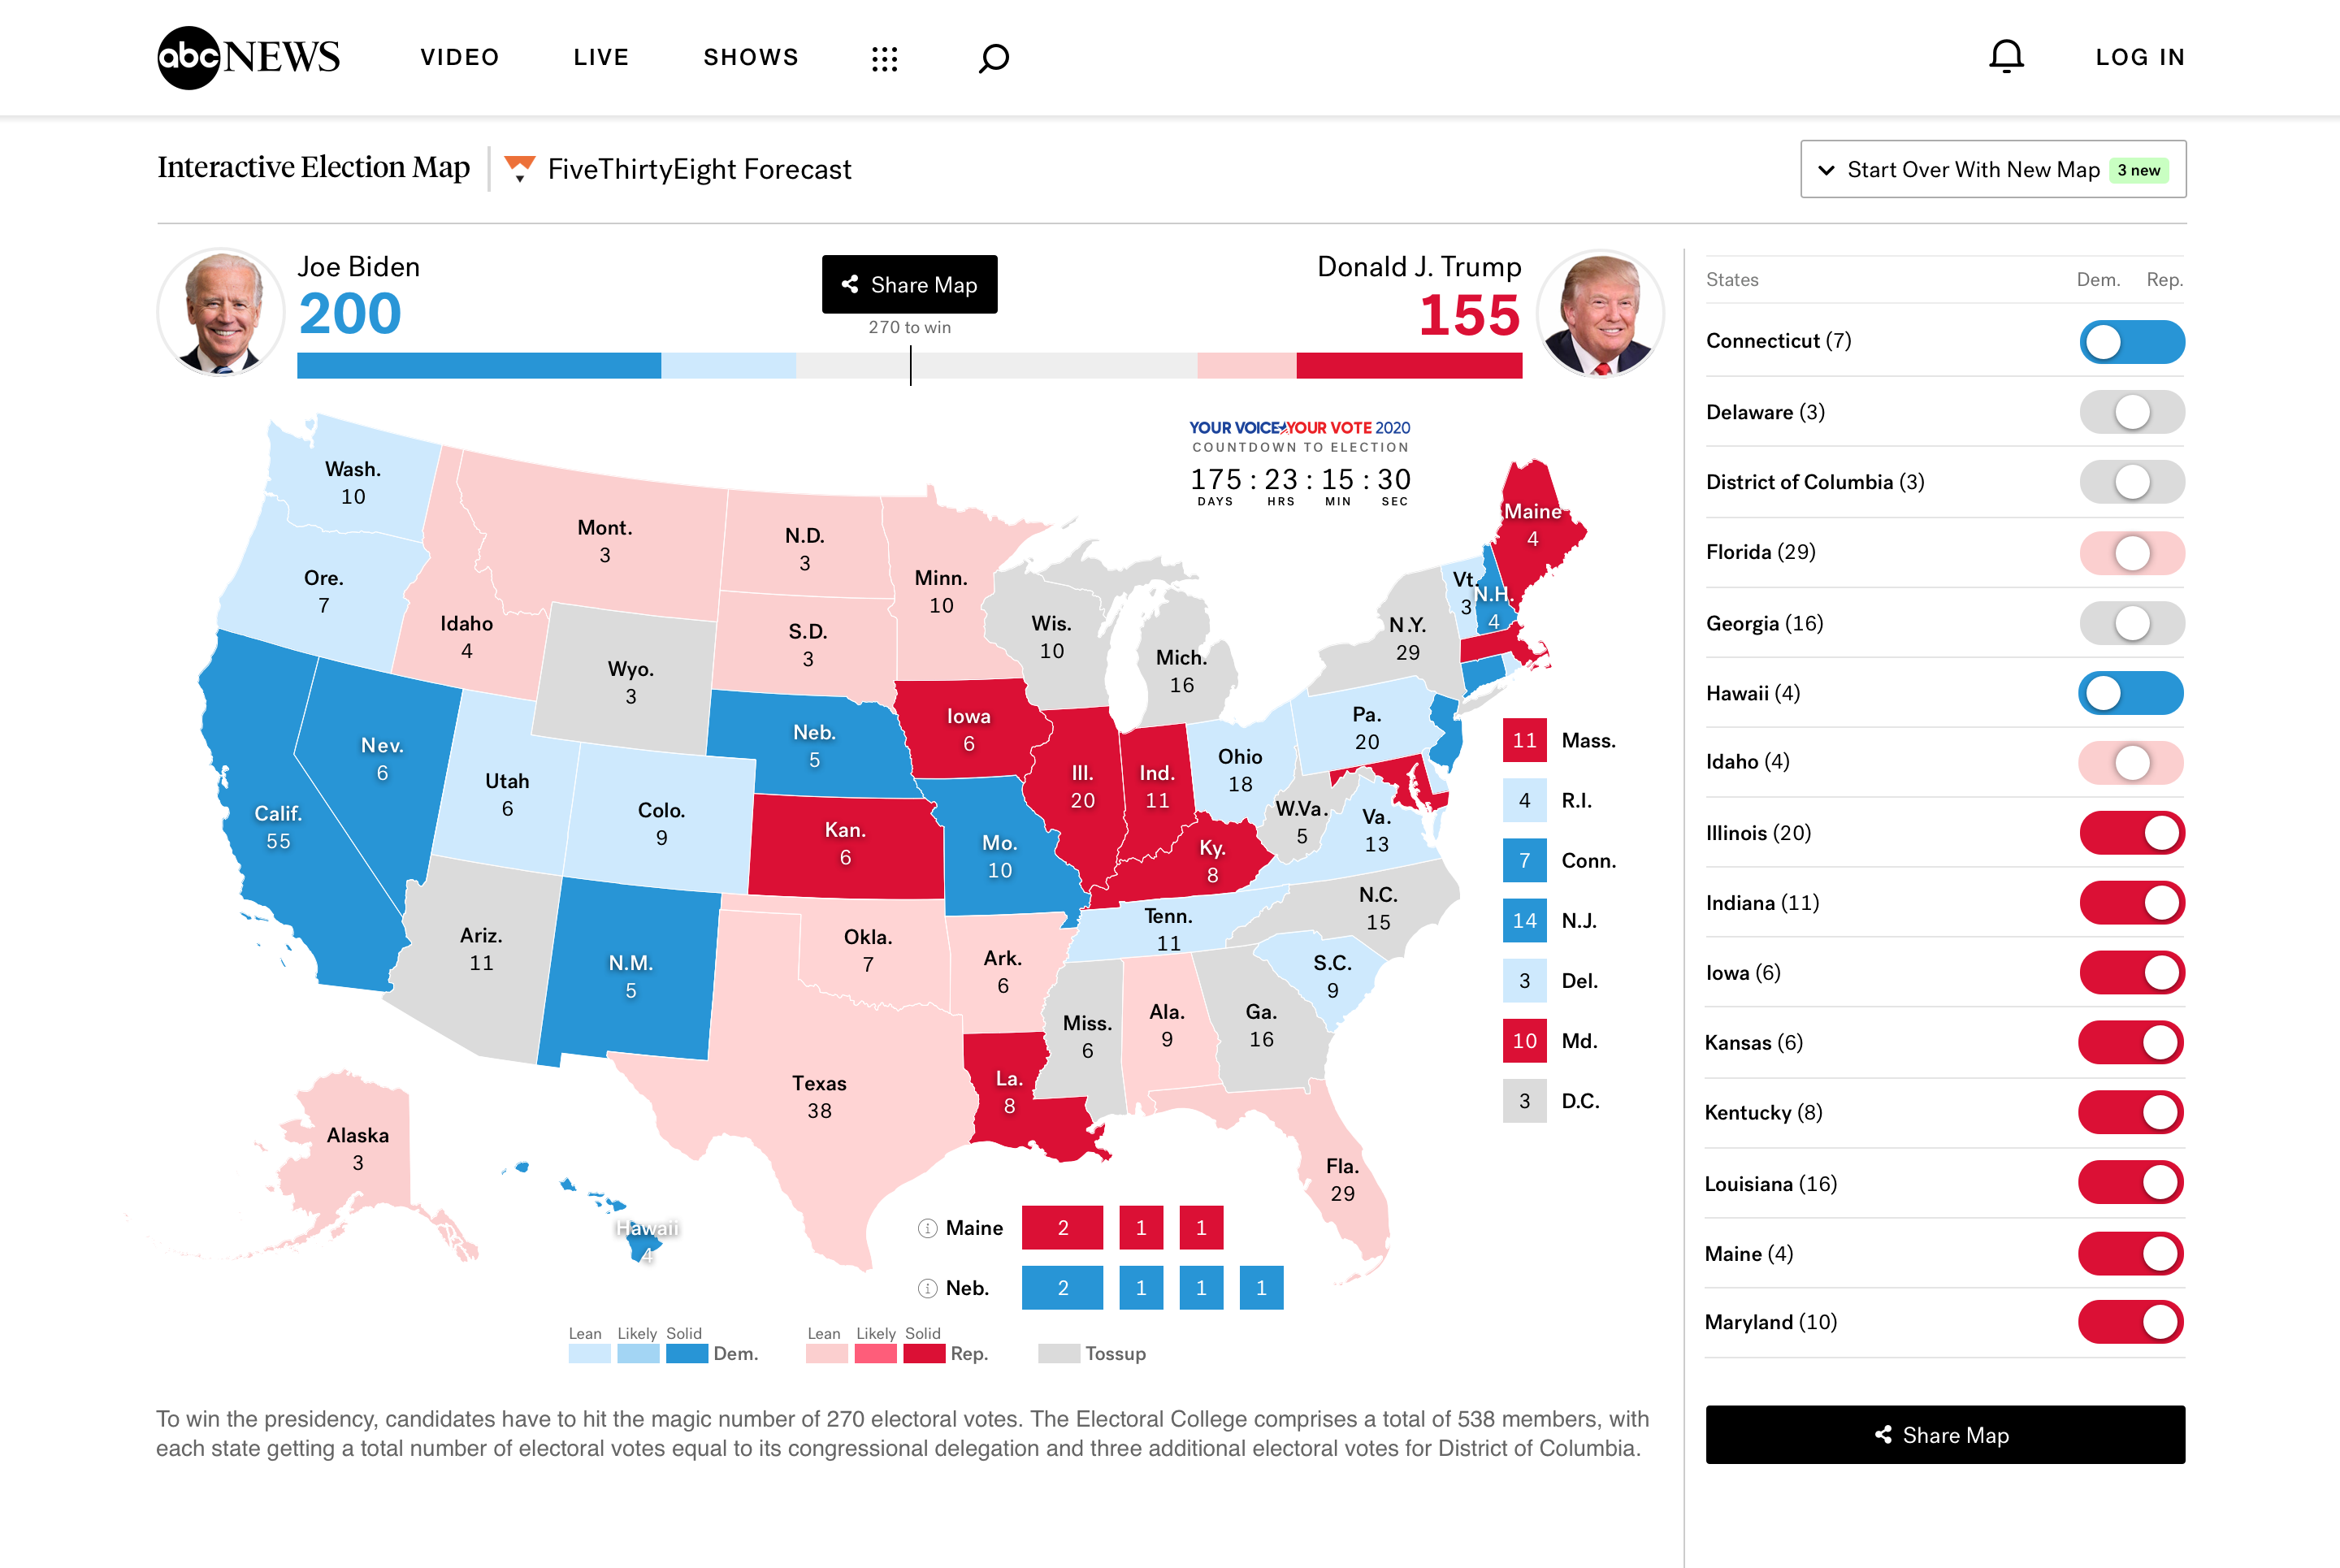
3. Balanced of Power Module
Problem:
- Users needed an easy way to see the impact of their choices.
Solution:
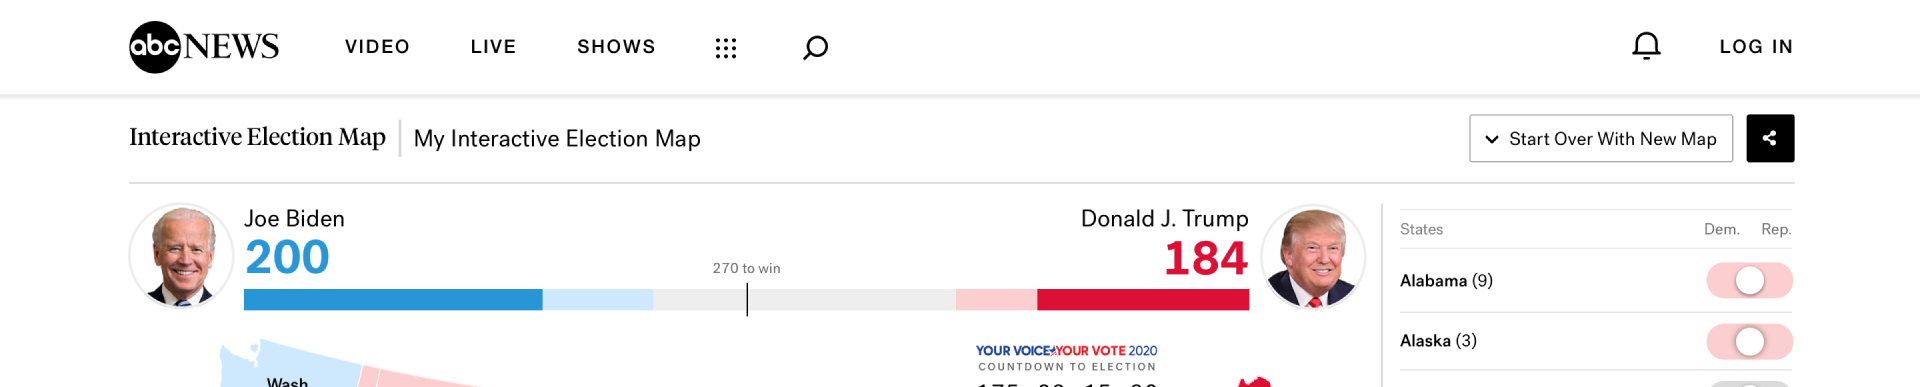
- A real-time electoral counter that updated instantly as states flipped, emphasizing the 270 threshold. An existing and familiar pattern.
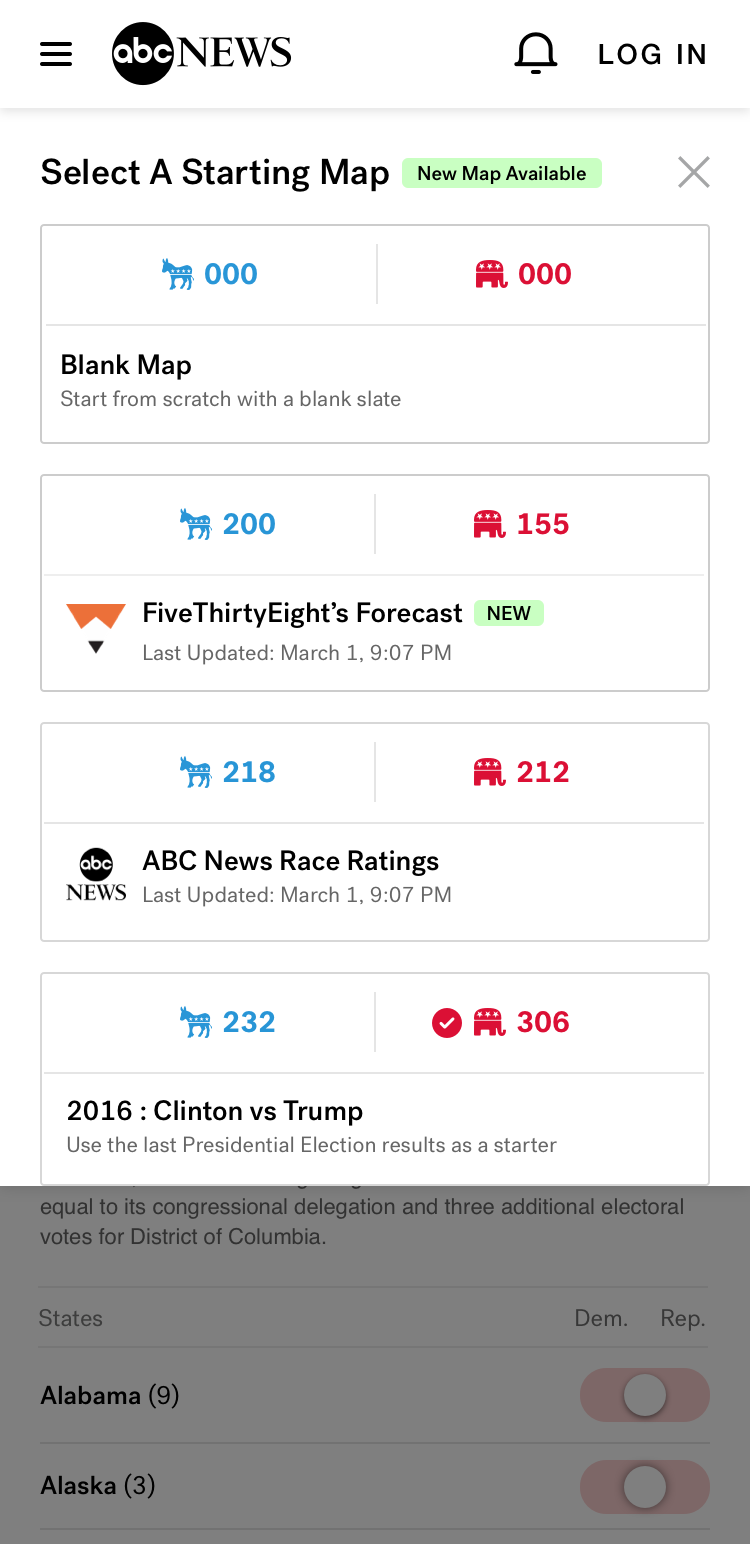
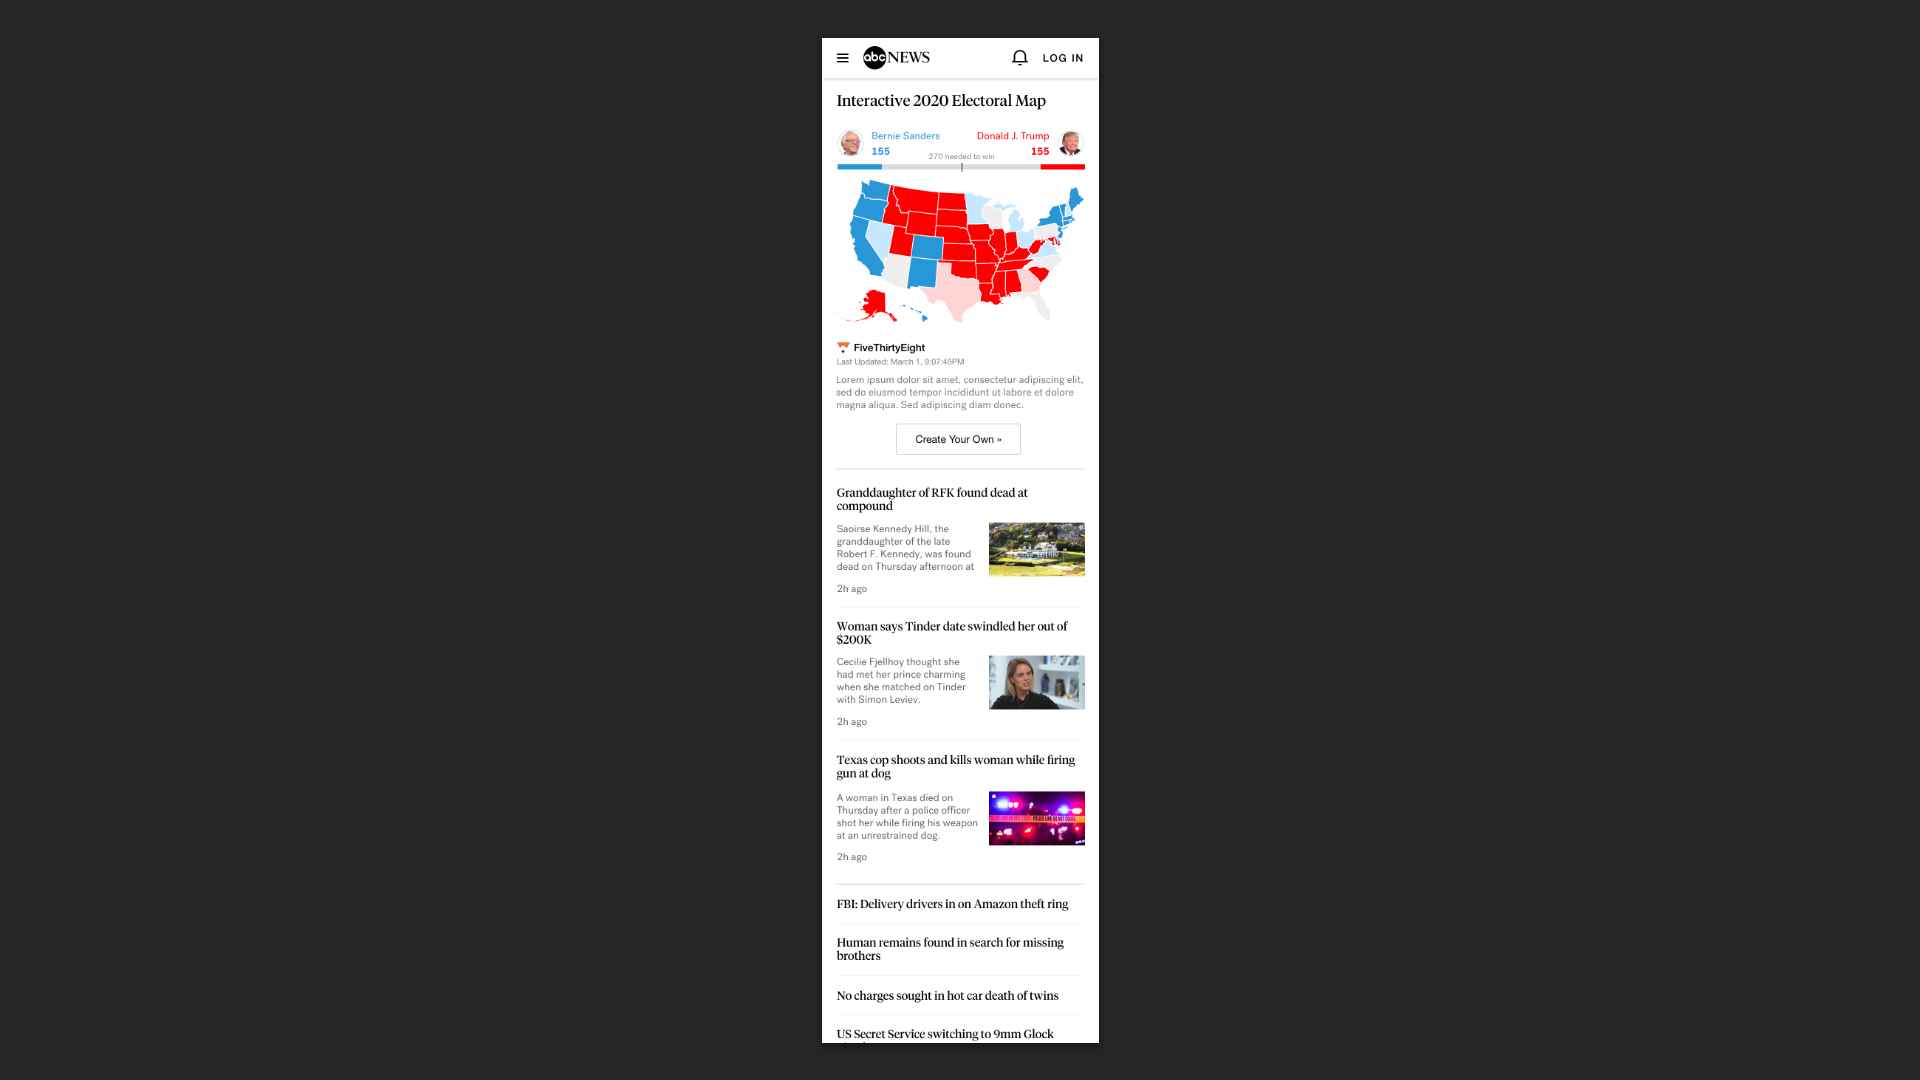
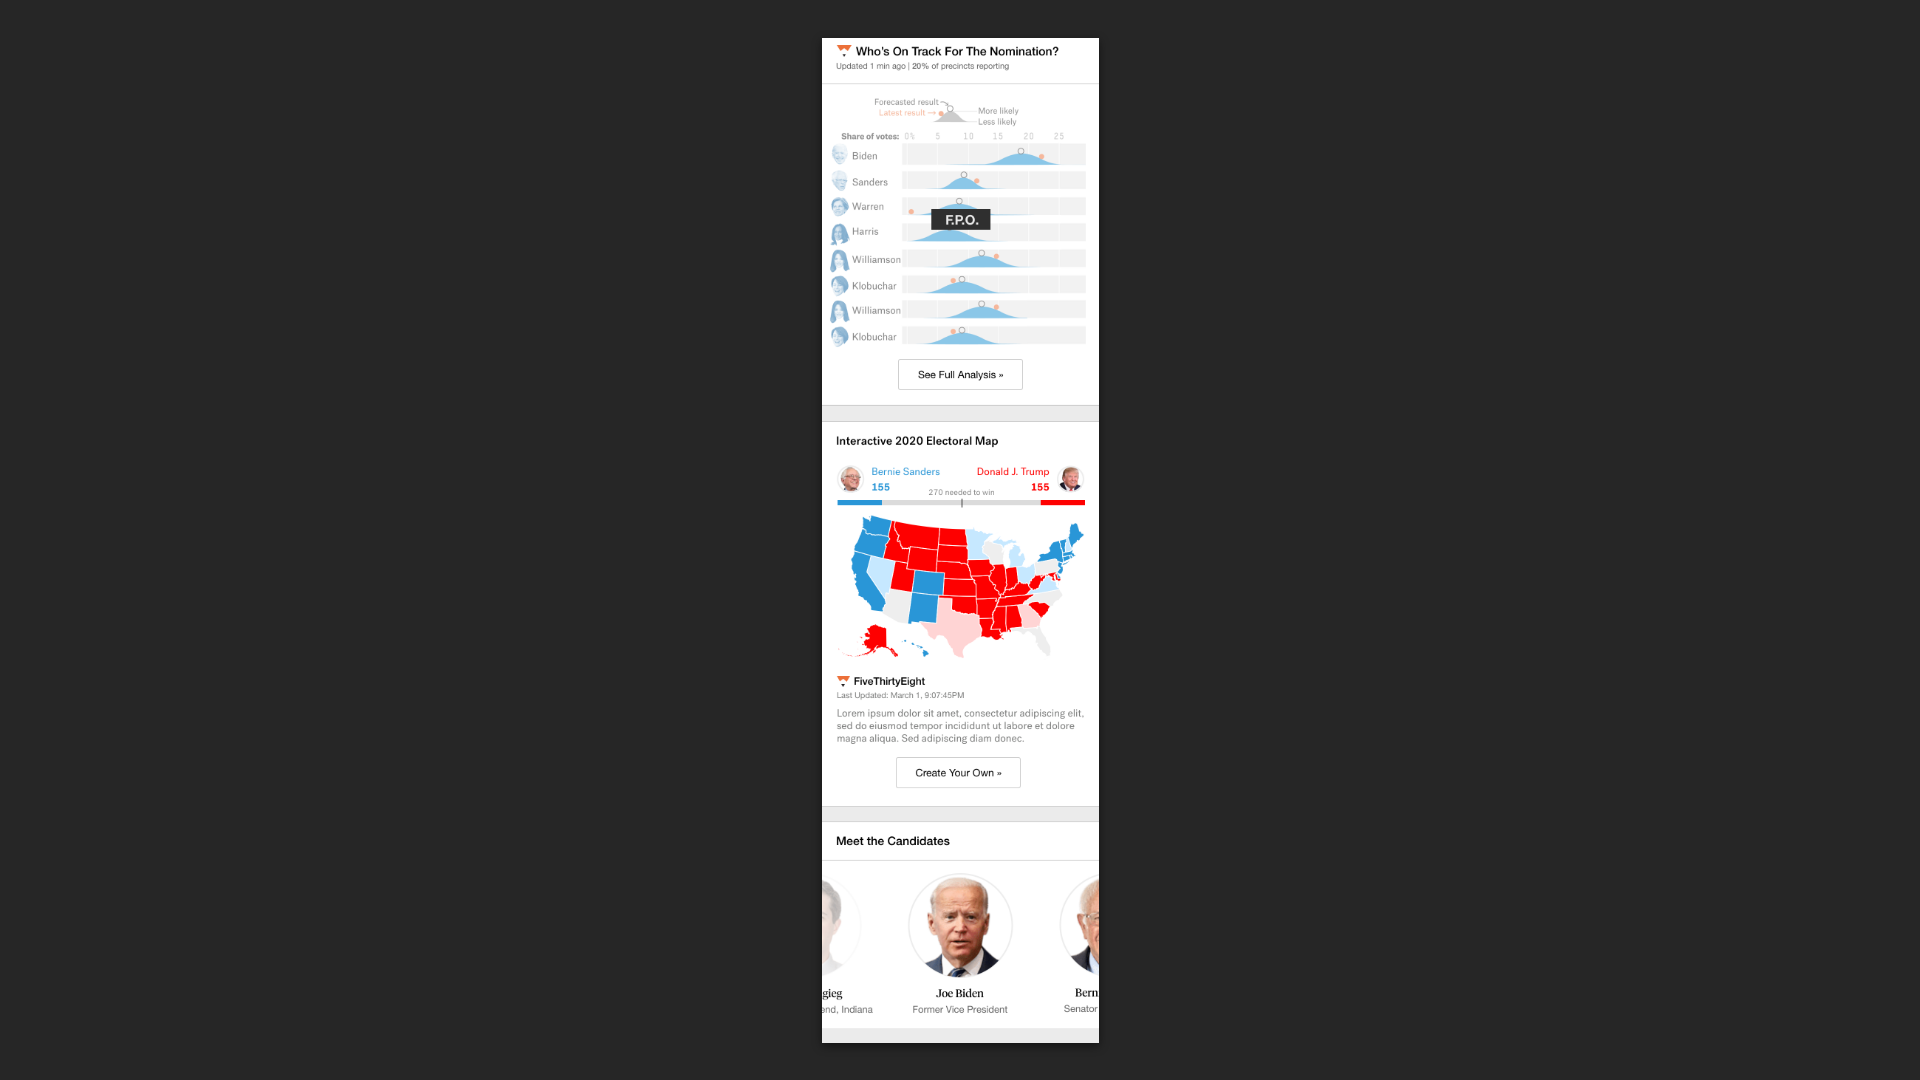
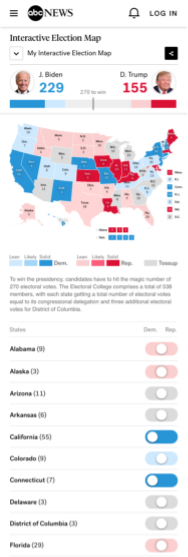
MOBILE CONSTRAINTS & SOLUTIONS
A key challenge was designing for limited screen real estate on mobile.
- On desktop: Users could view multiple curated maps at once.
- On mobile: I simplified the interface by removing previews and using a scrollable list-only design.
- Interaction states were optimized for smaller tap targets, ensuring parity between mobile and desktop experiences.
This approach ensure that there were consistency across platforms while respecting the constraints of mobile usability.
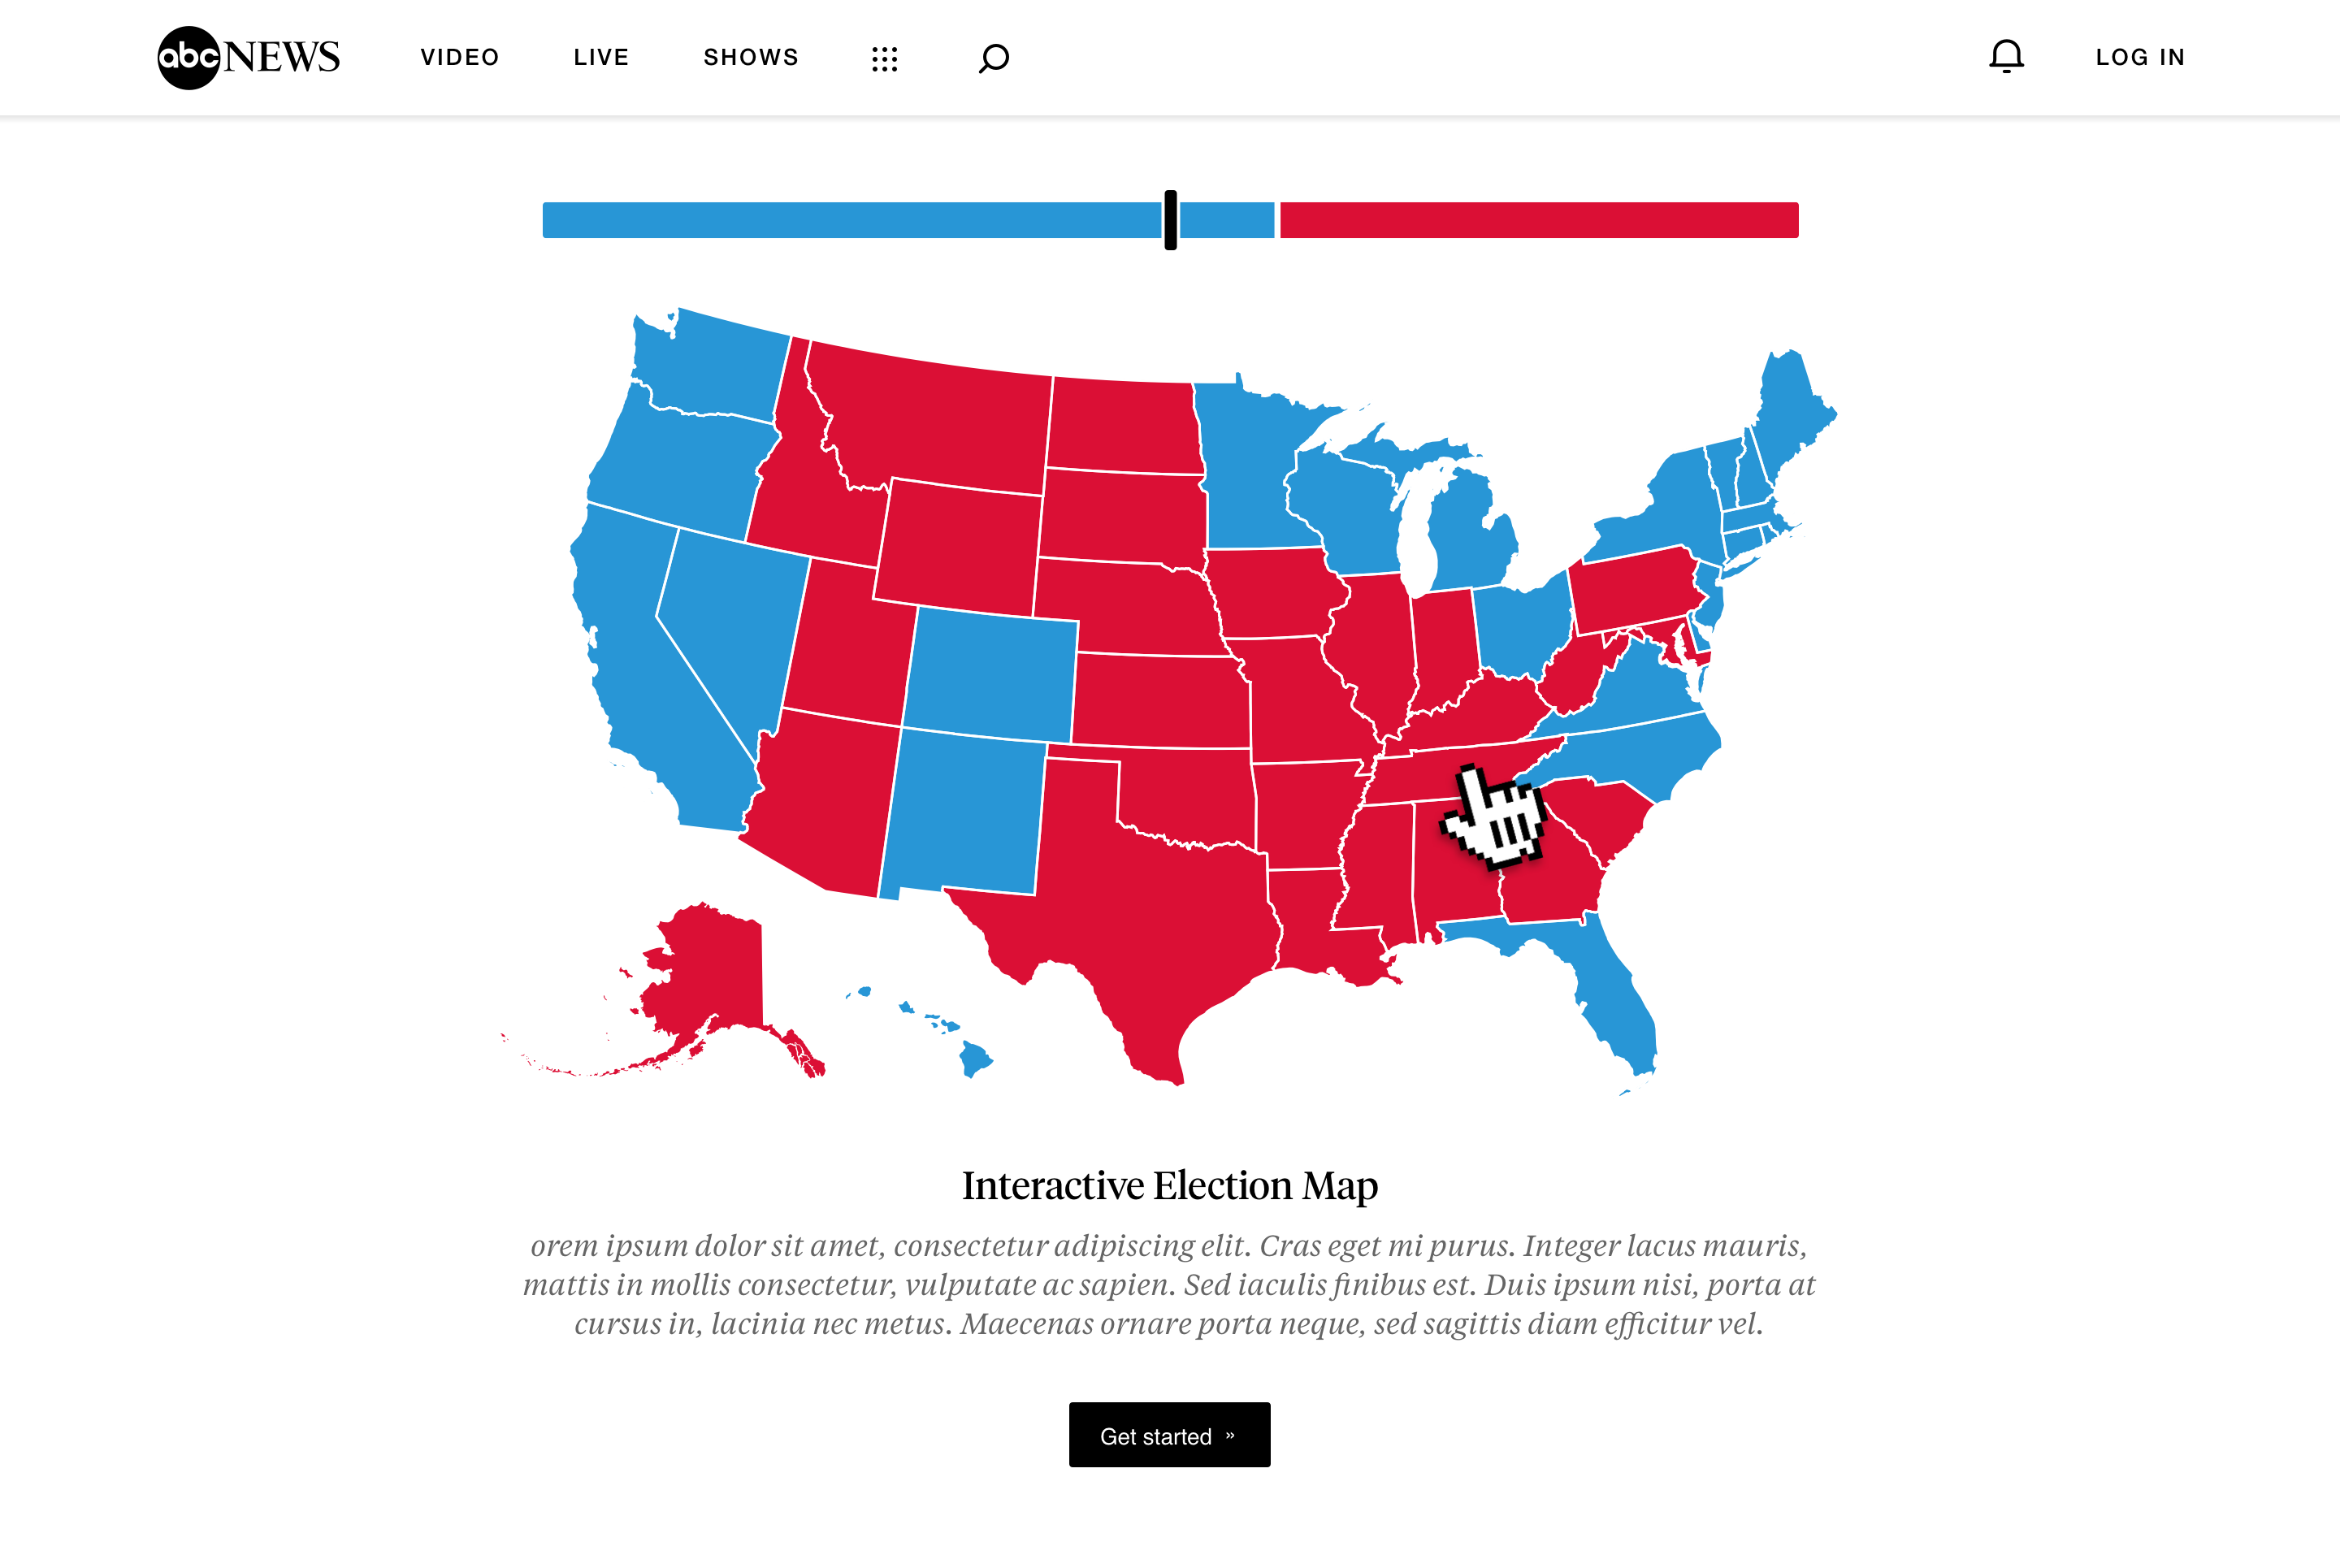
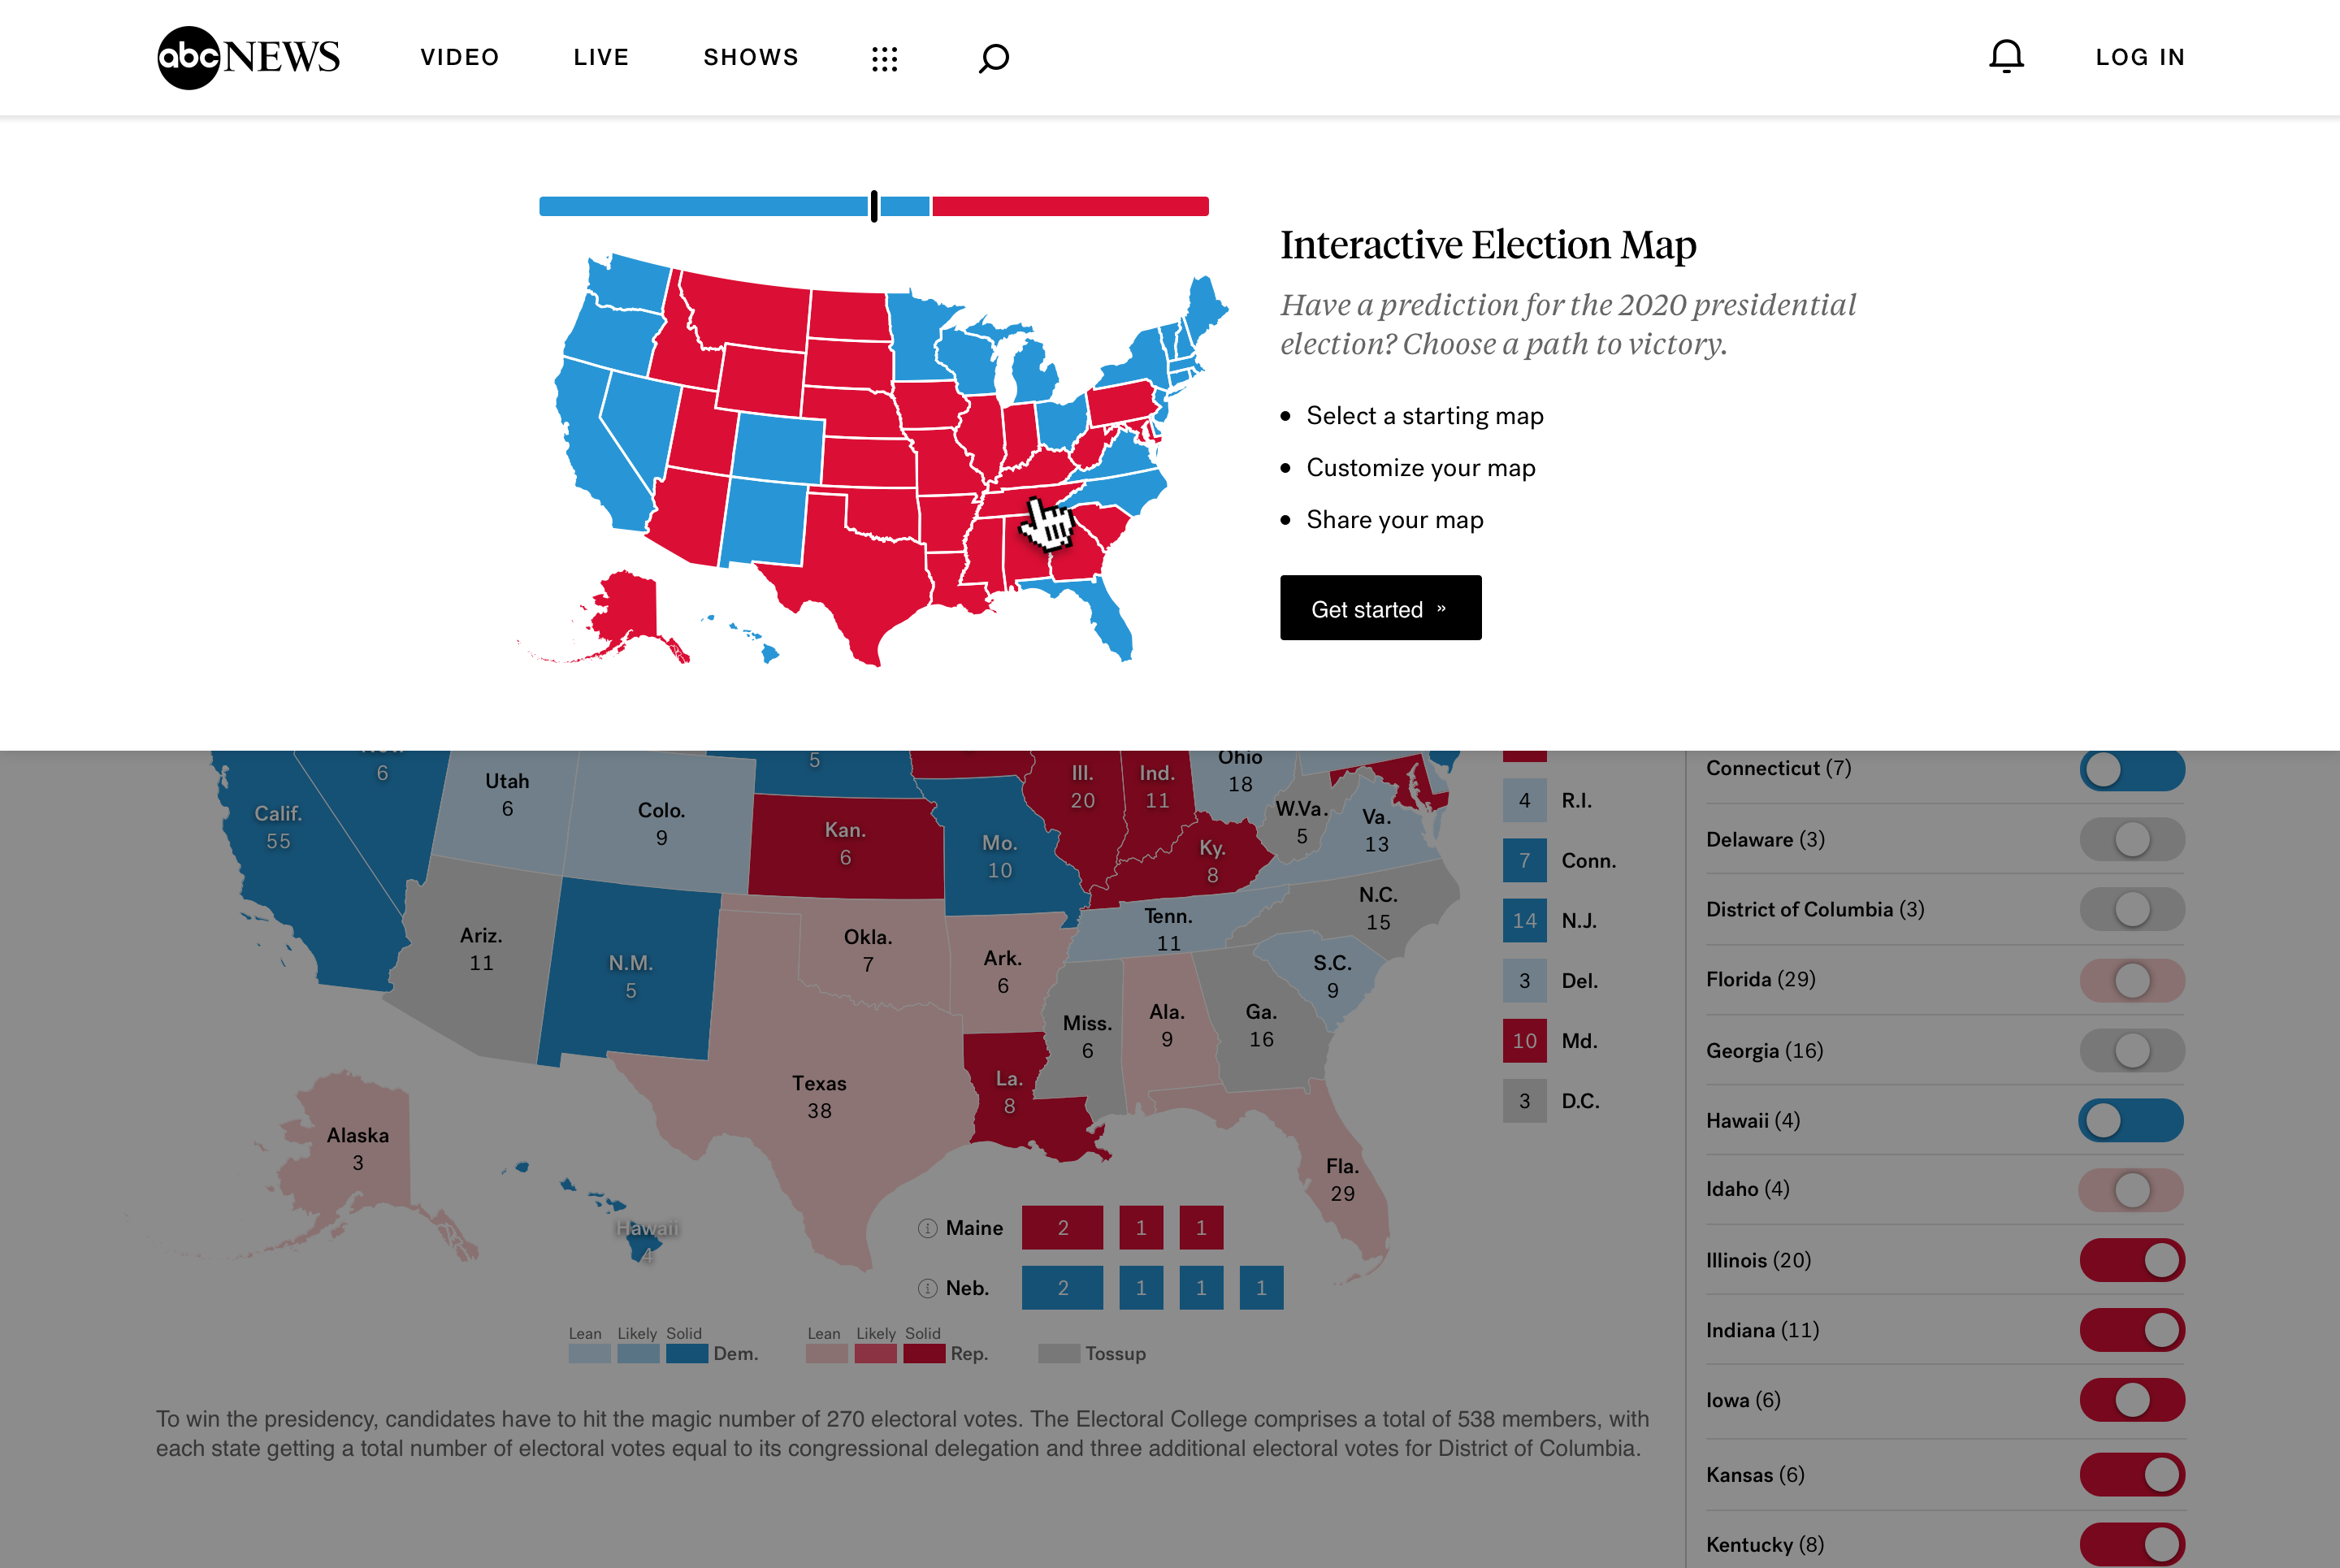
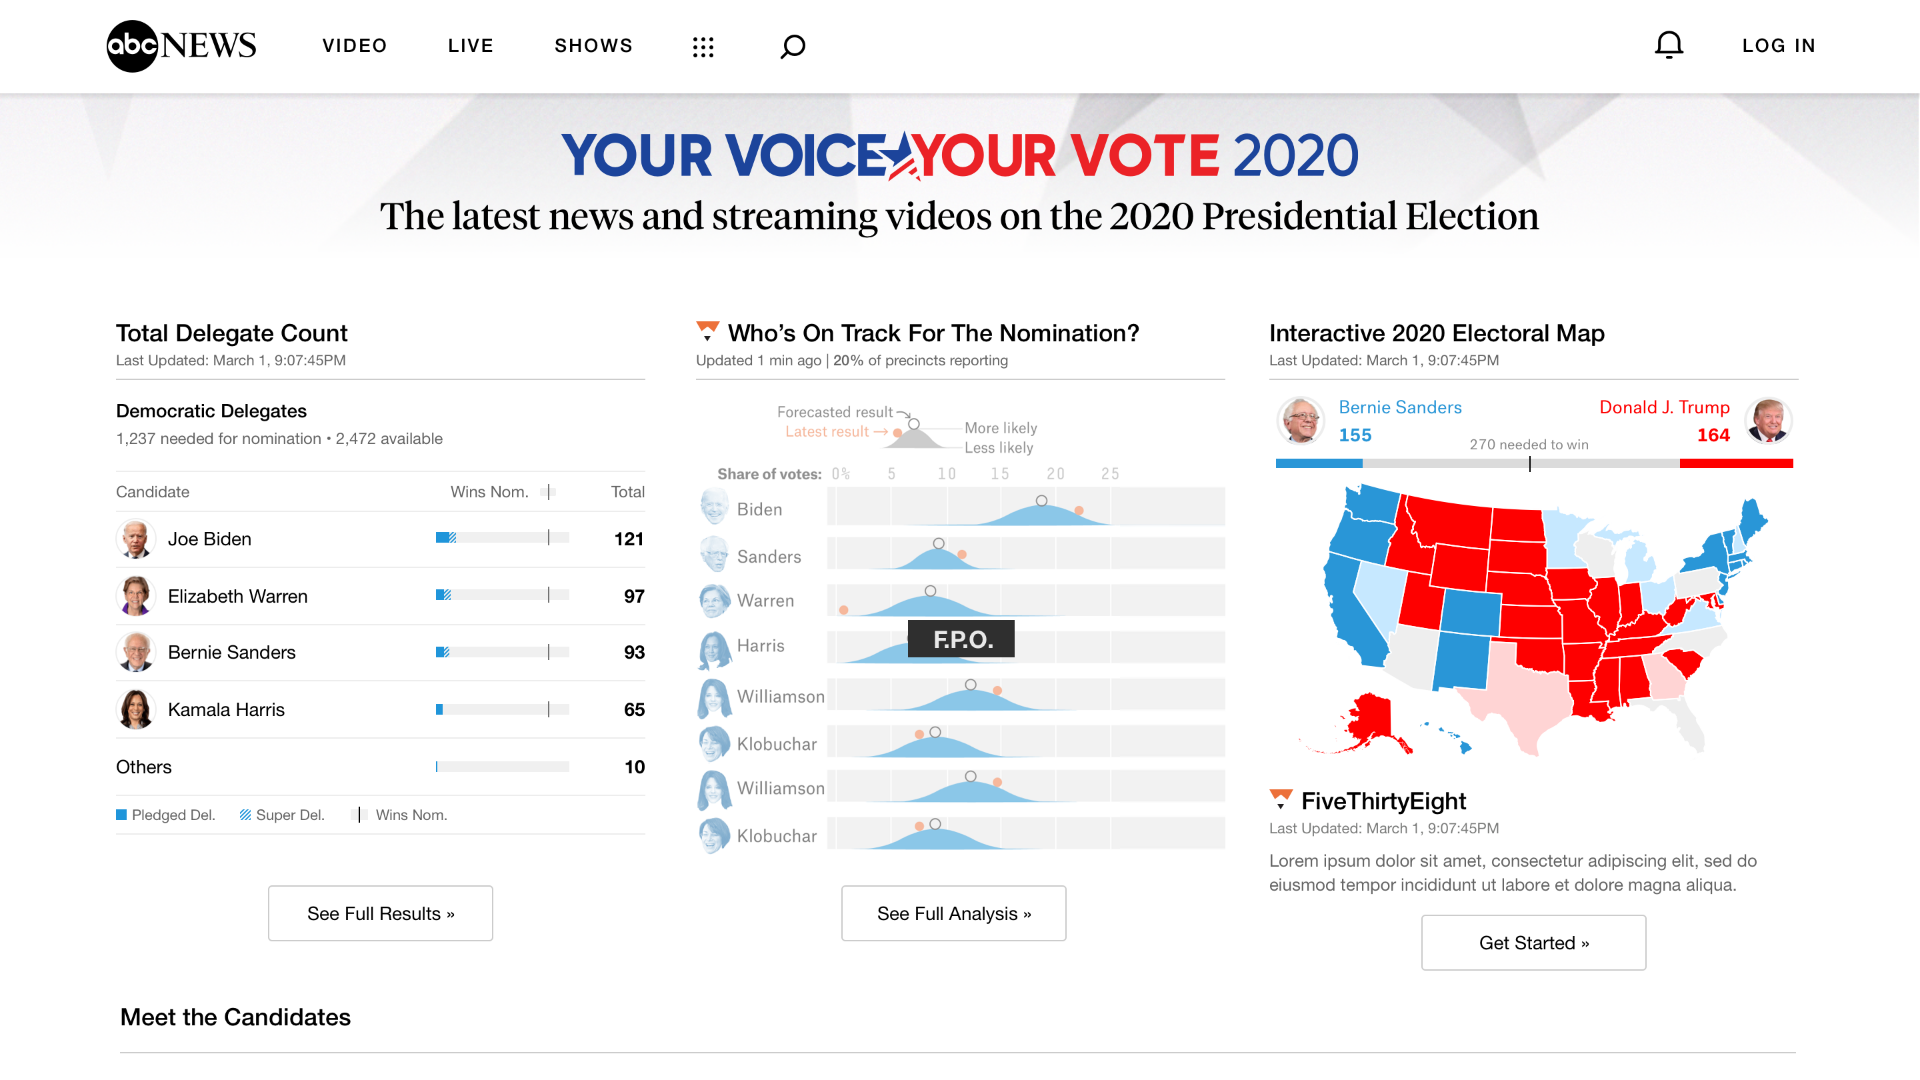
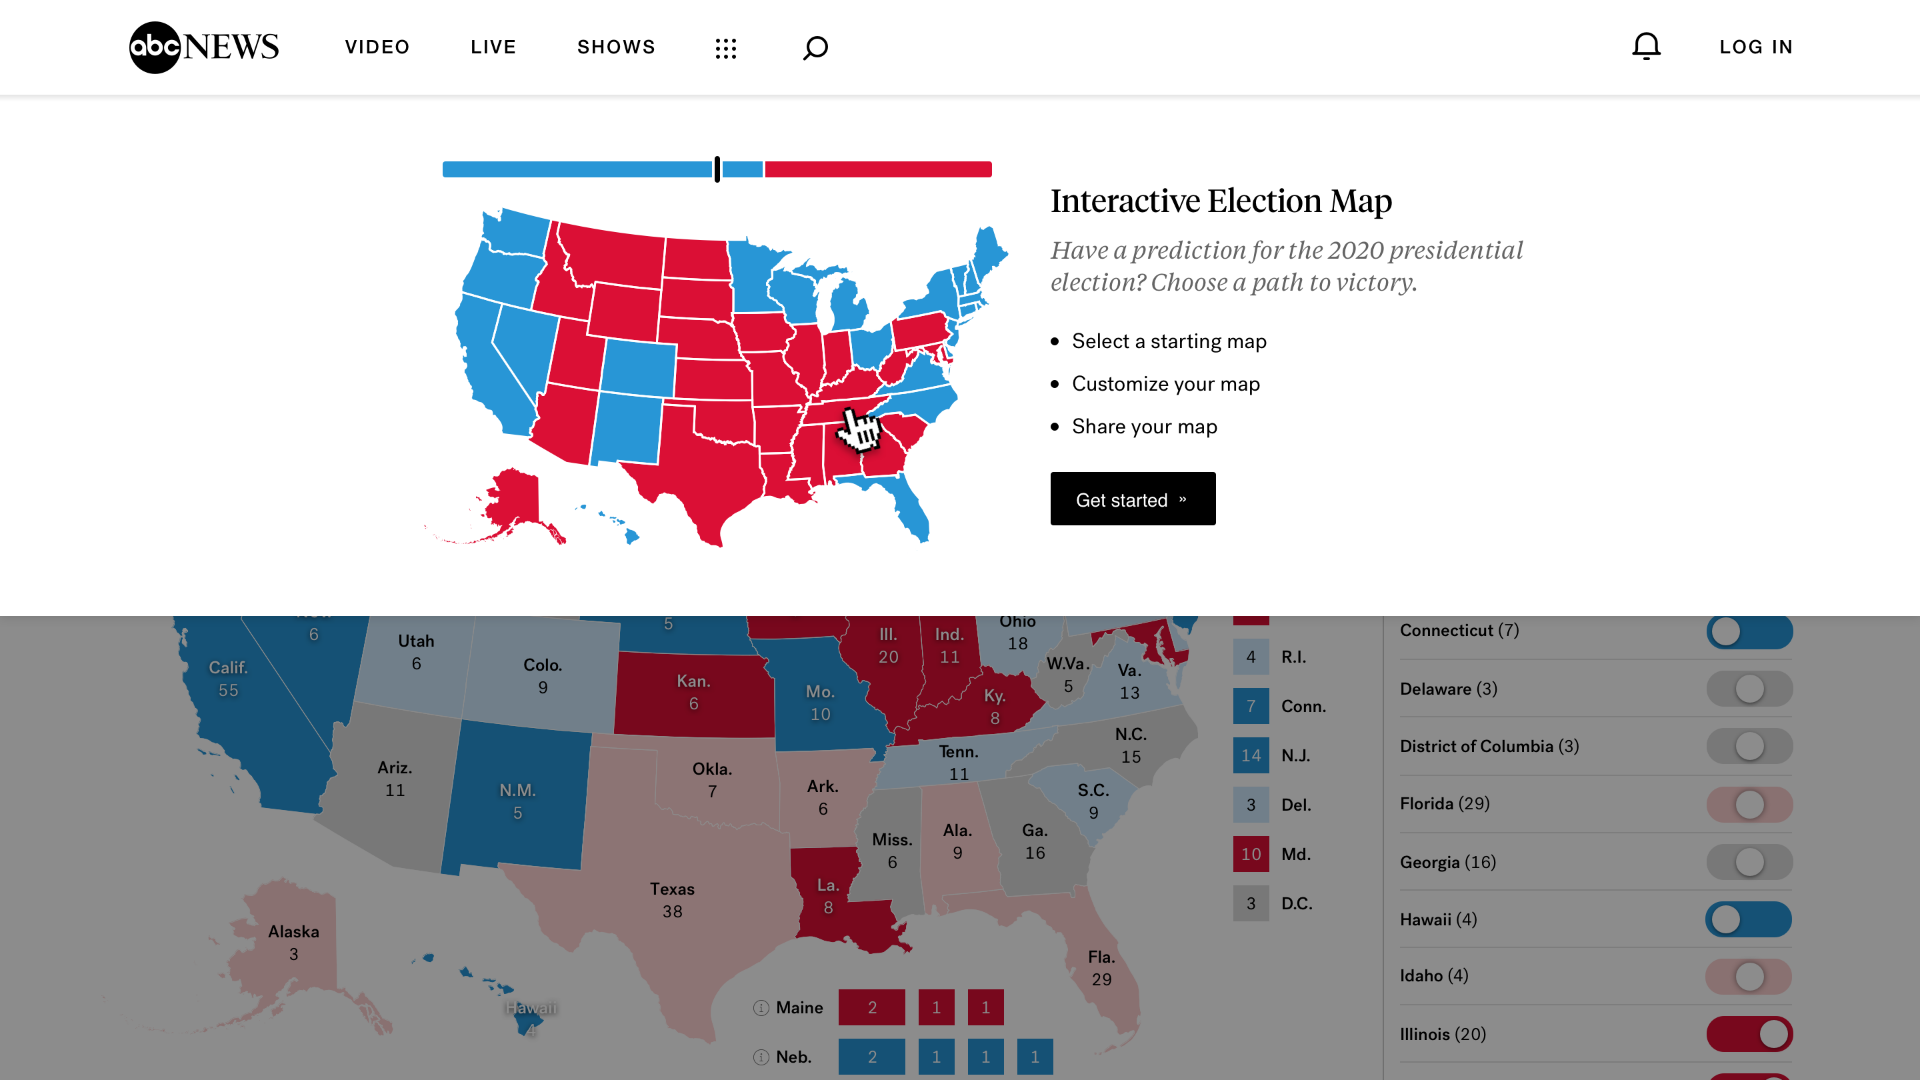
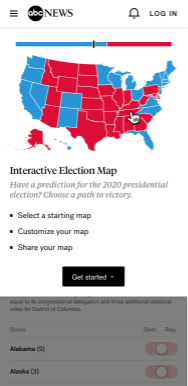
LANDING & ONBOARDING
The original concept included a full landing page, but testing revealed that it created unnecessary friction.
Before: A large landing page that pulled users away from interactive map
After: A lightweight onboarding drawer integrated into the navigation bar.
The onboarding experience was reframed into a 3-step instruction set:
1. Selecting a starting map
2. Customize your map
3. Share your map/predictions
This streamlined entry point encouraged users to dive in faster without losing context.
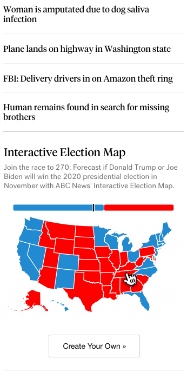
PROMO MODULES
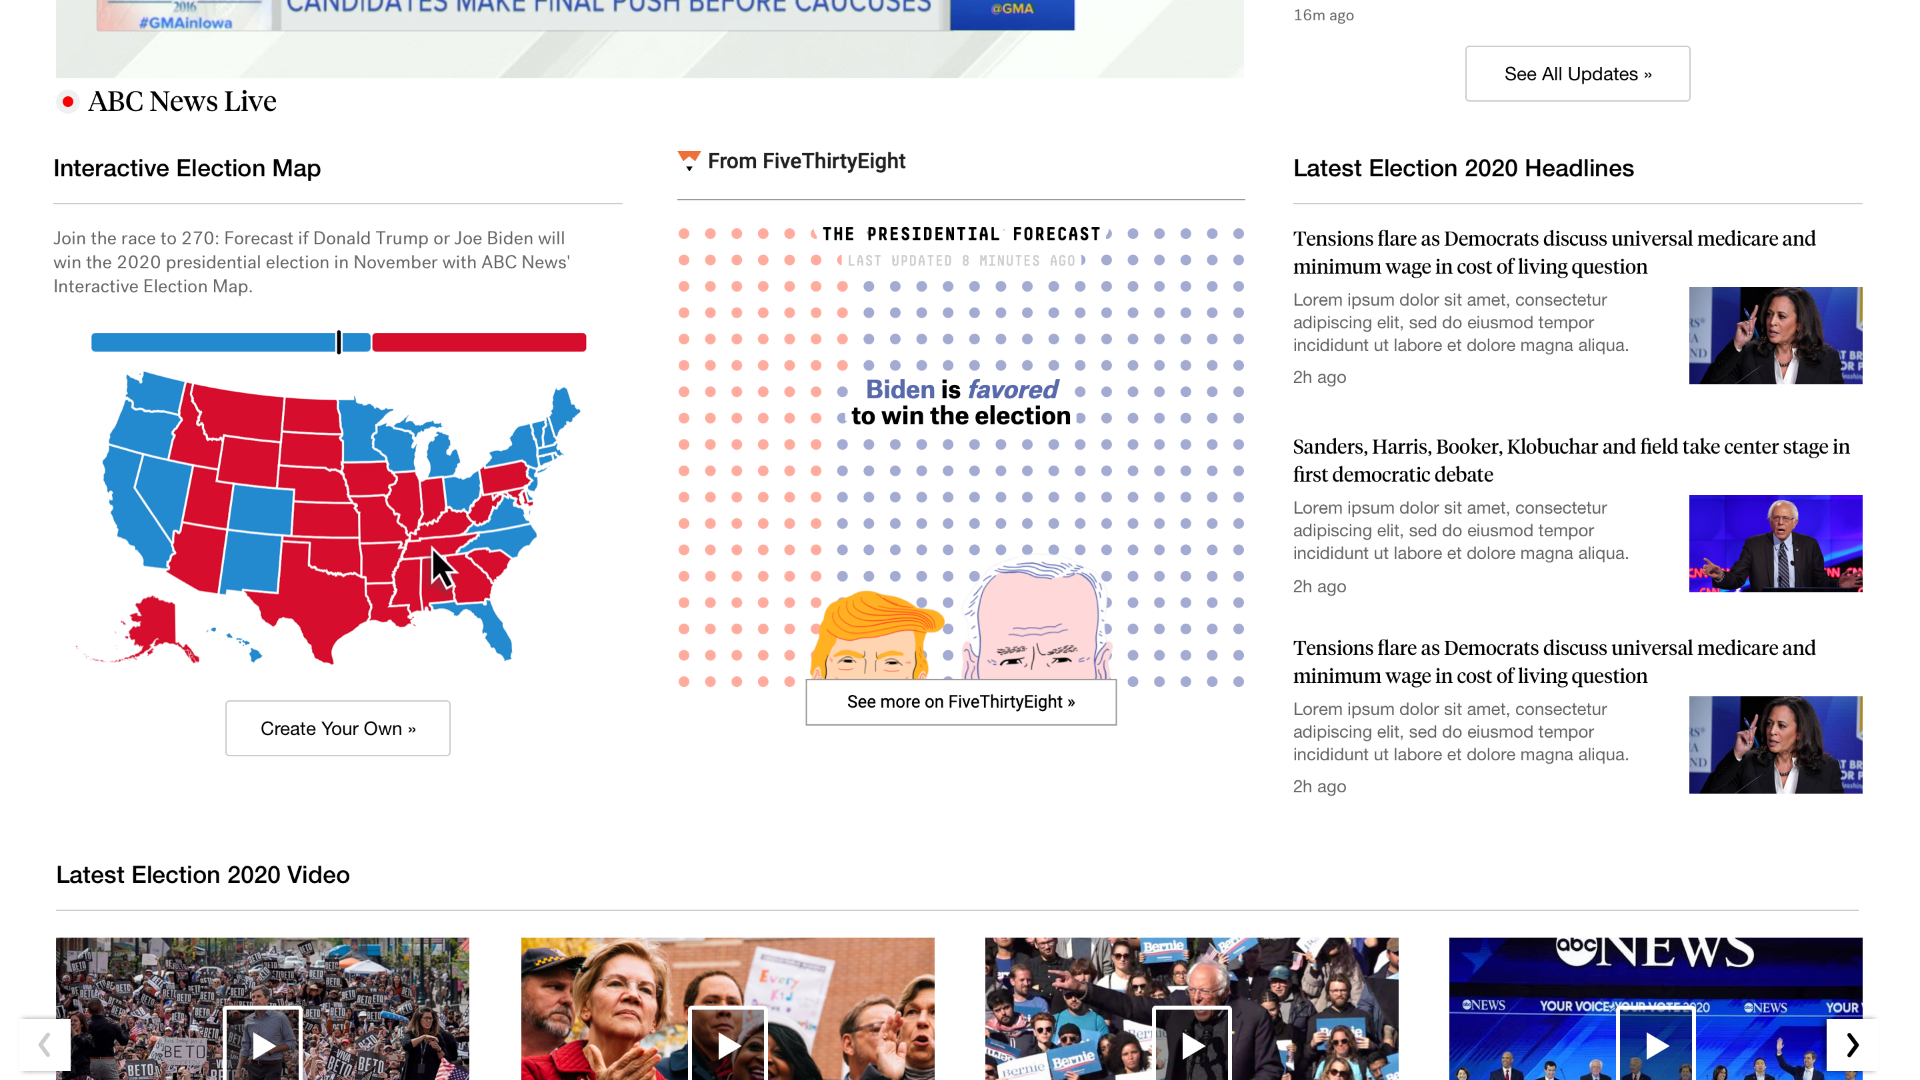
After putting the main product together, I worked on designing what the users will see on the homepage.
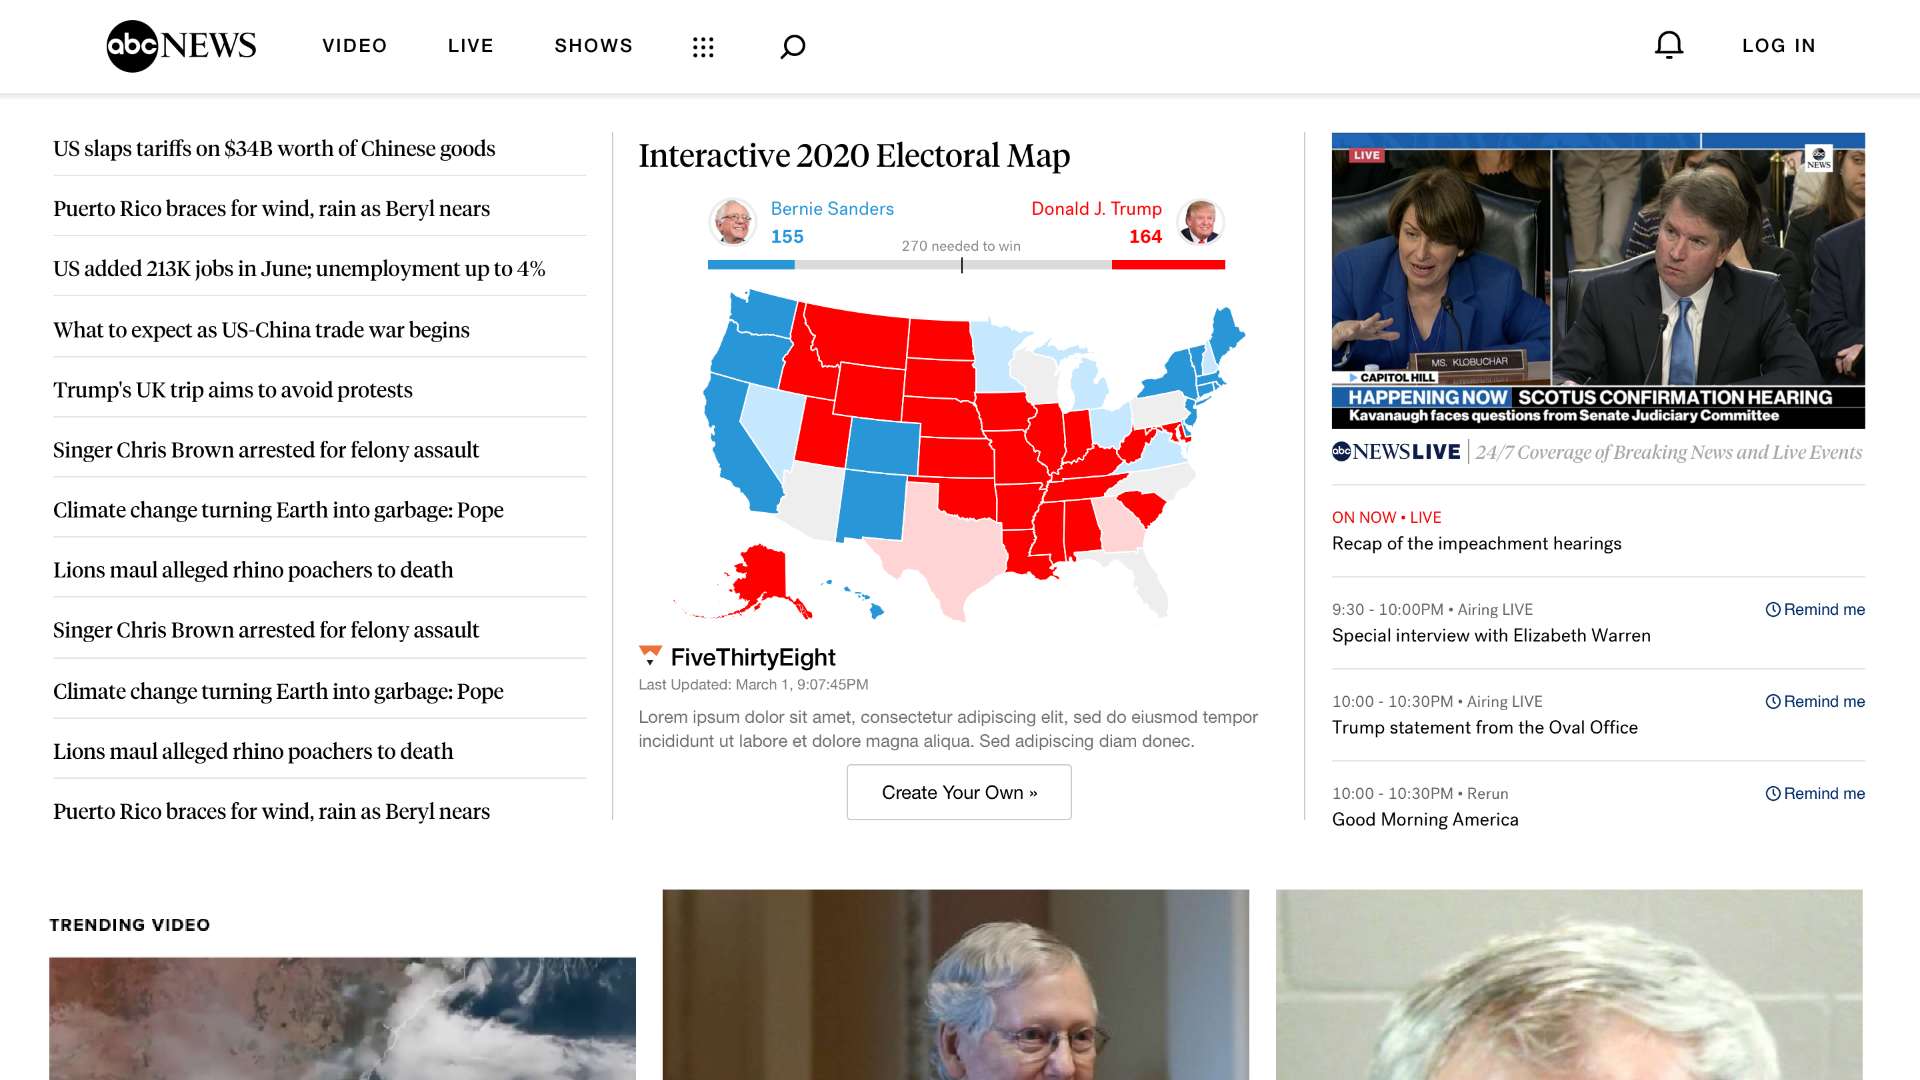
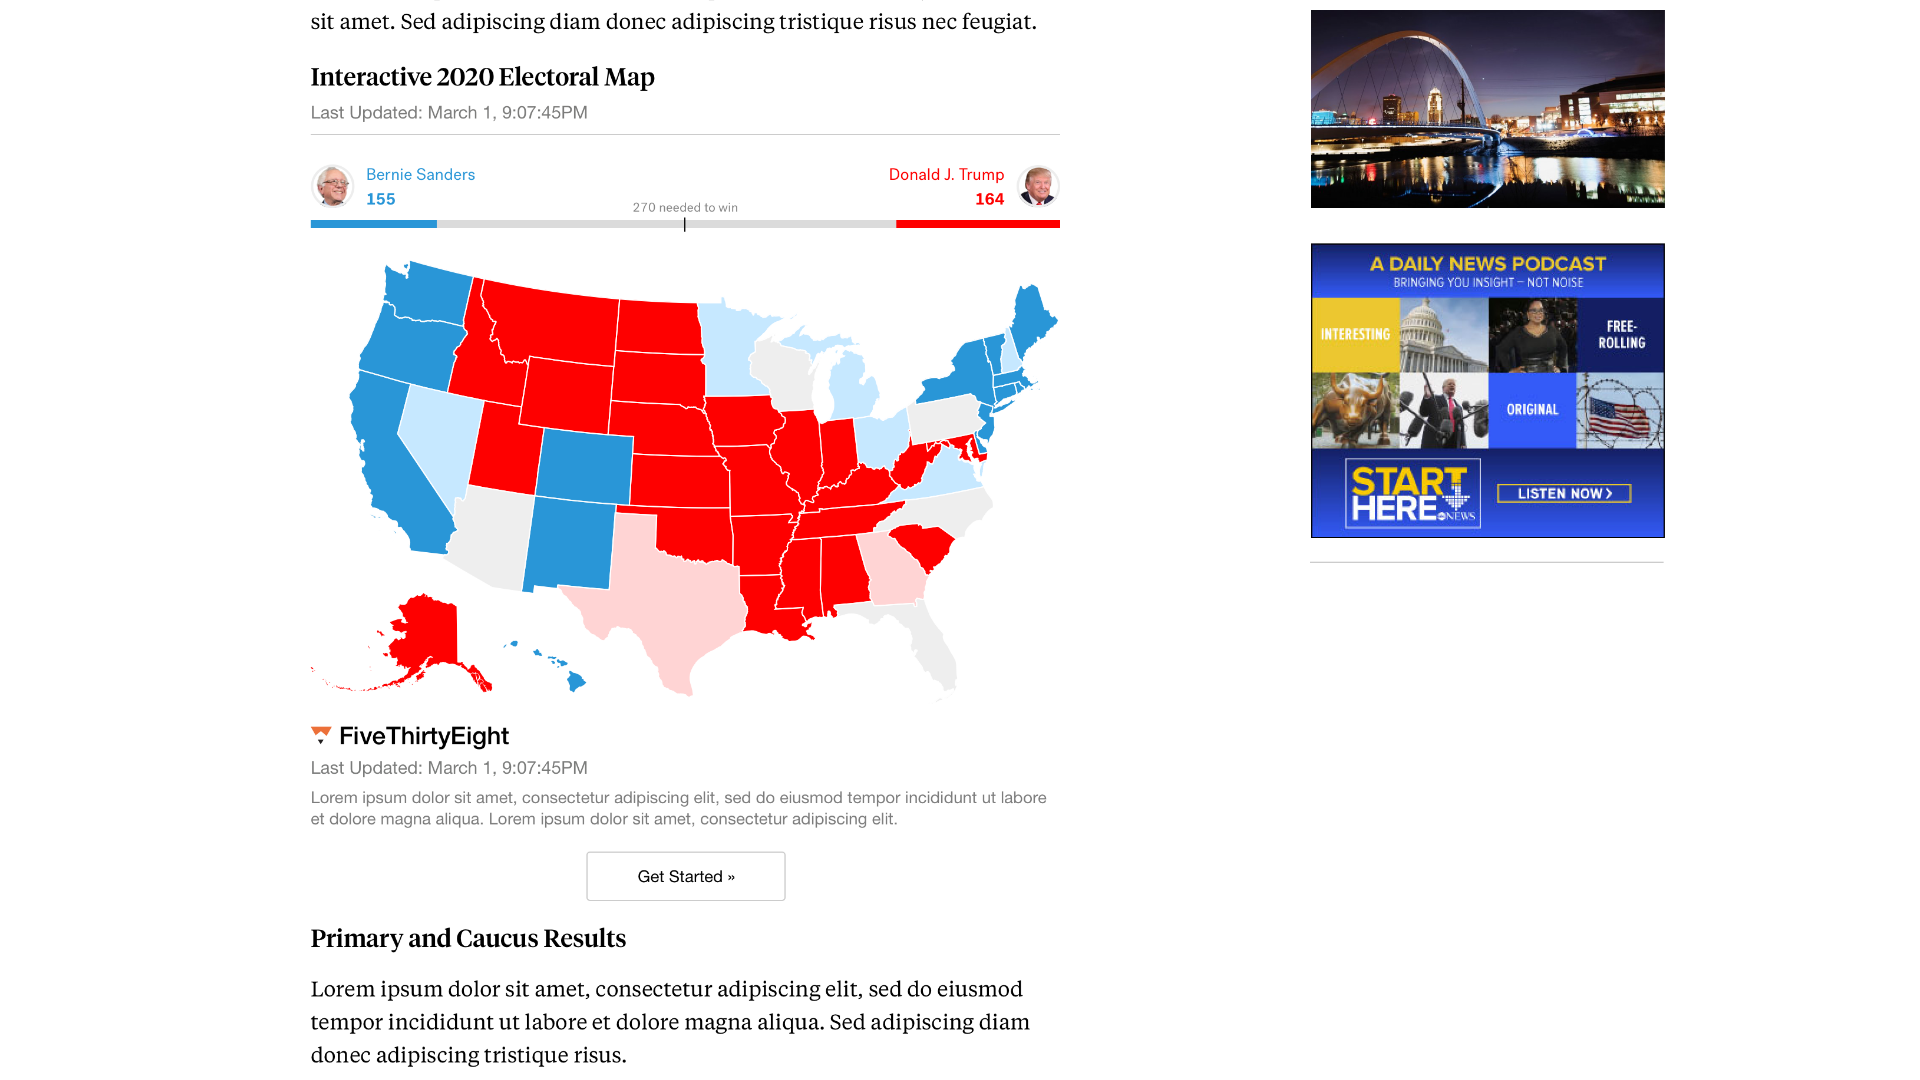
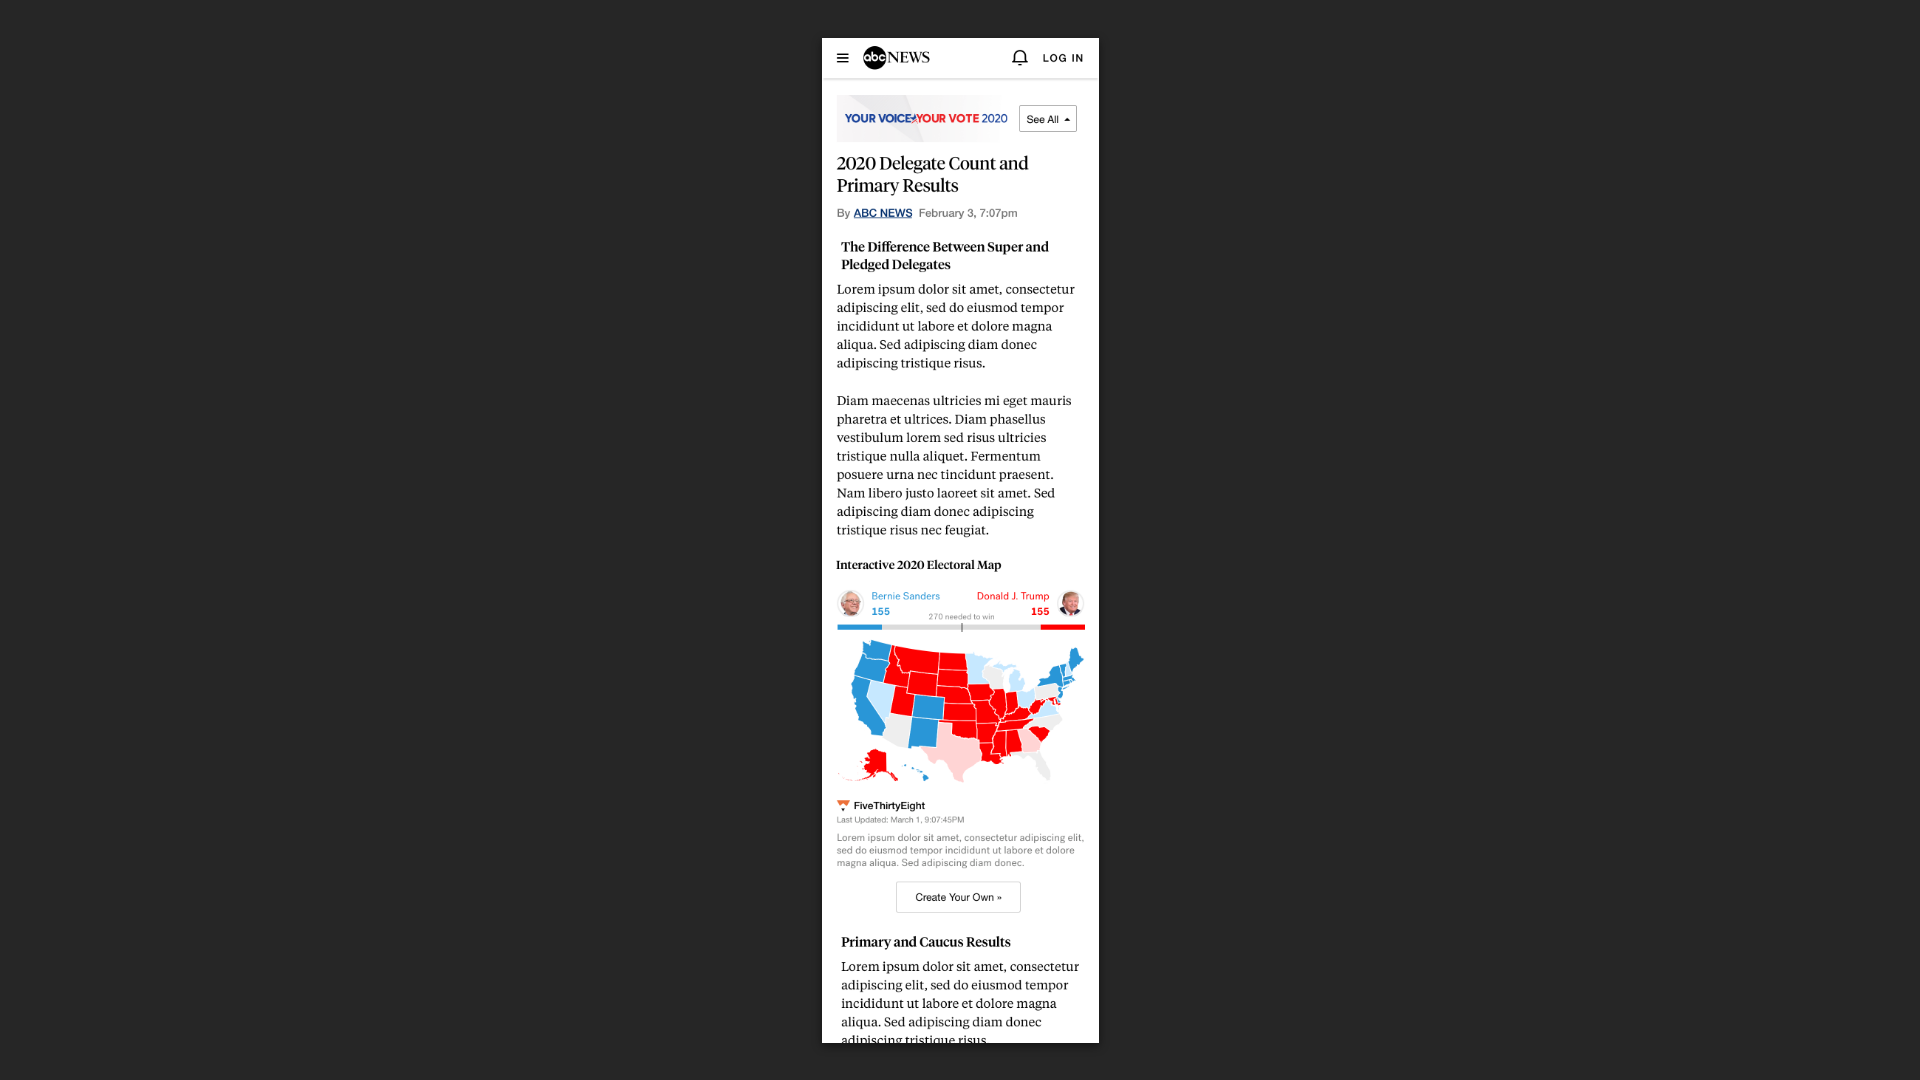
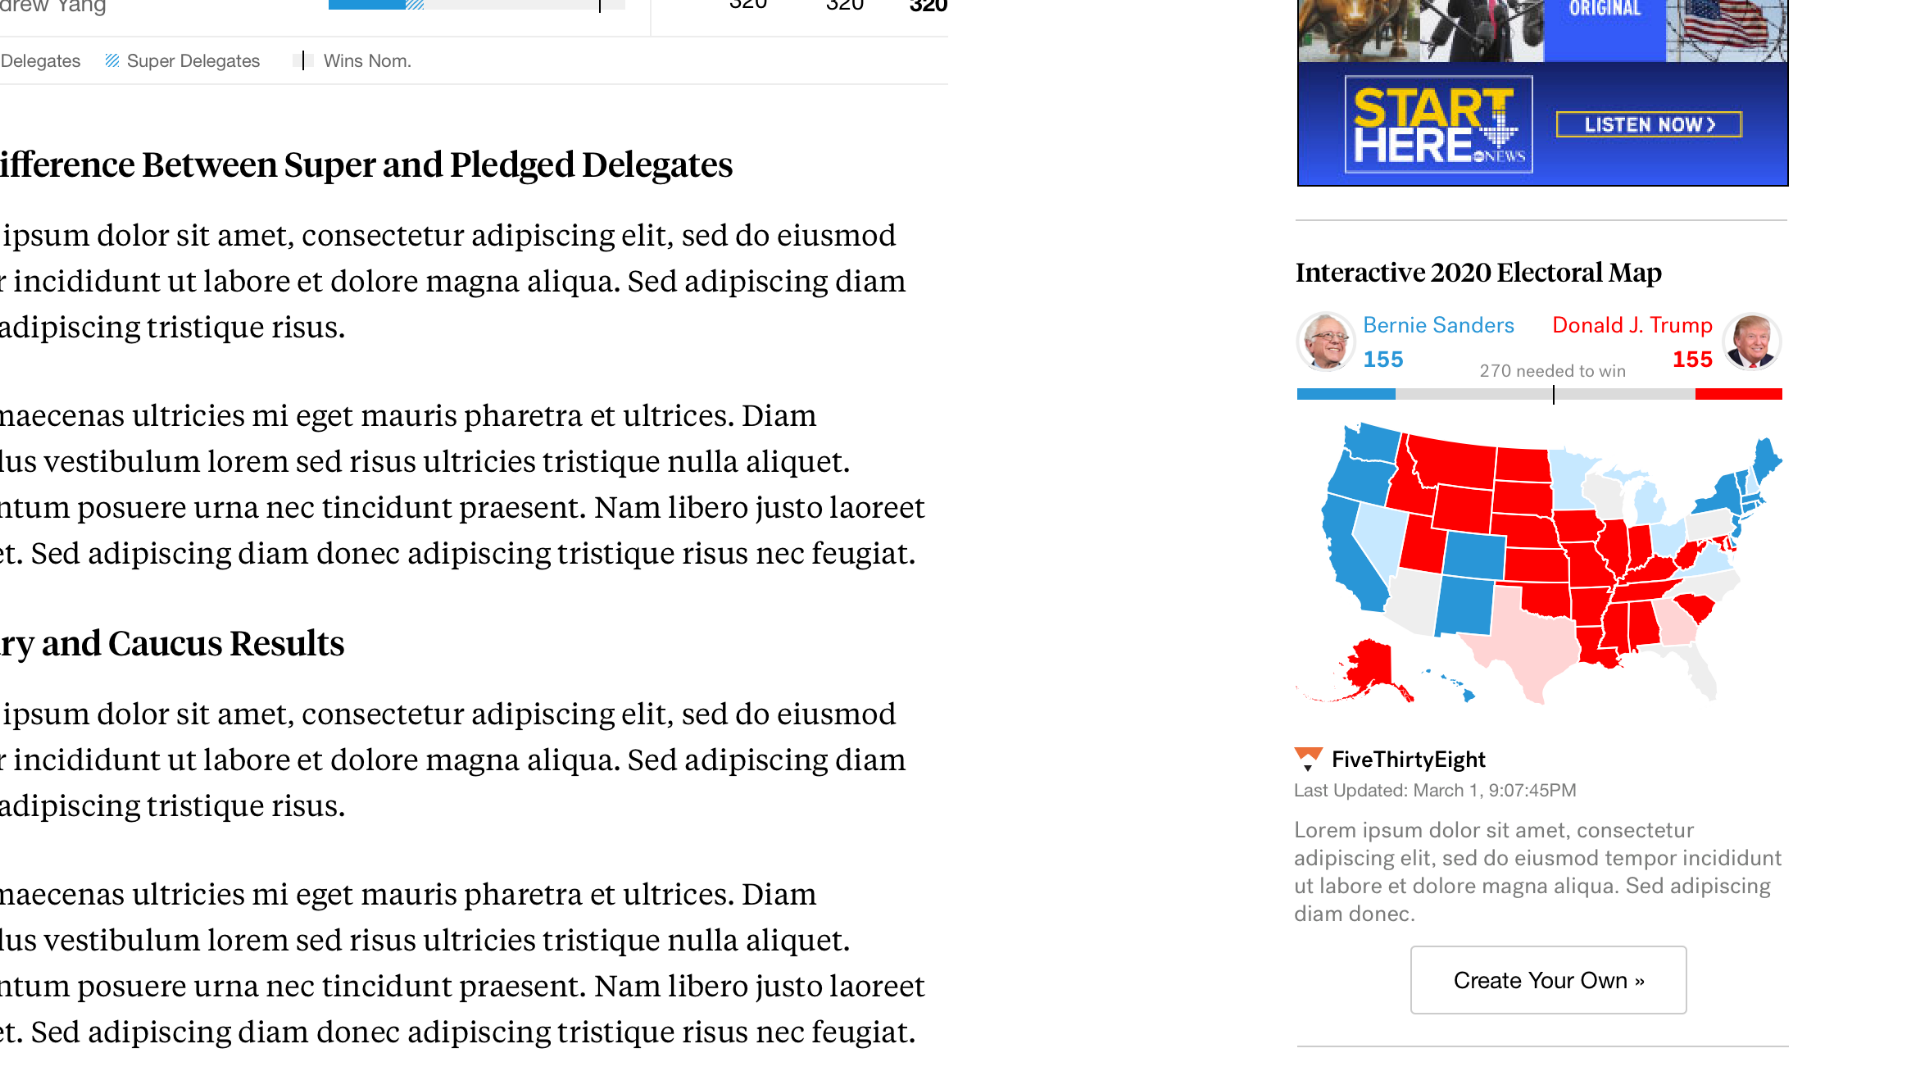
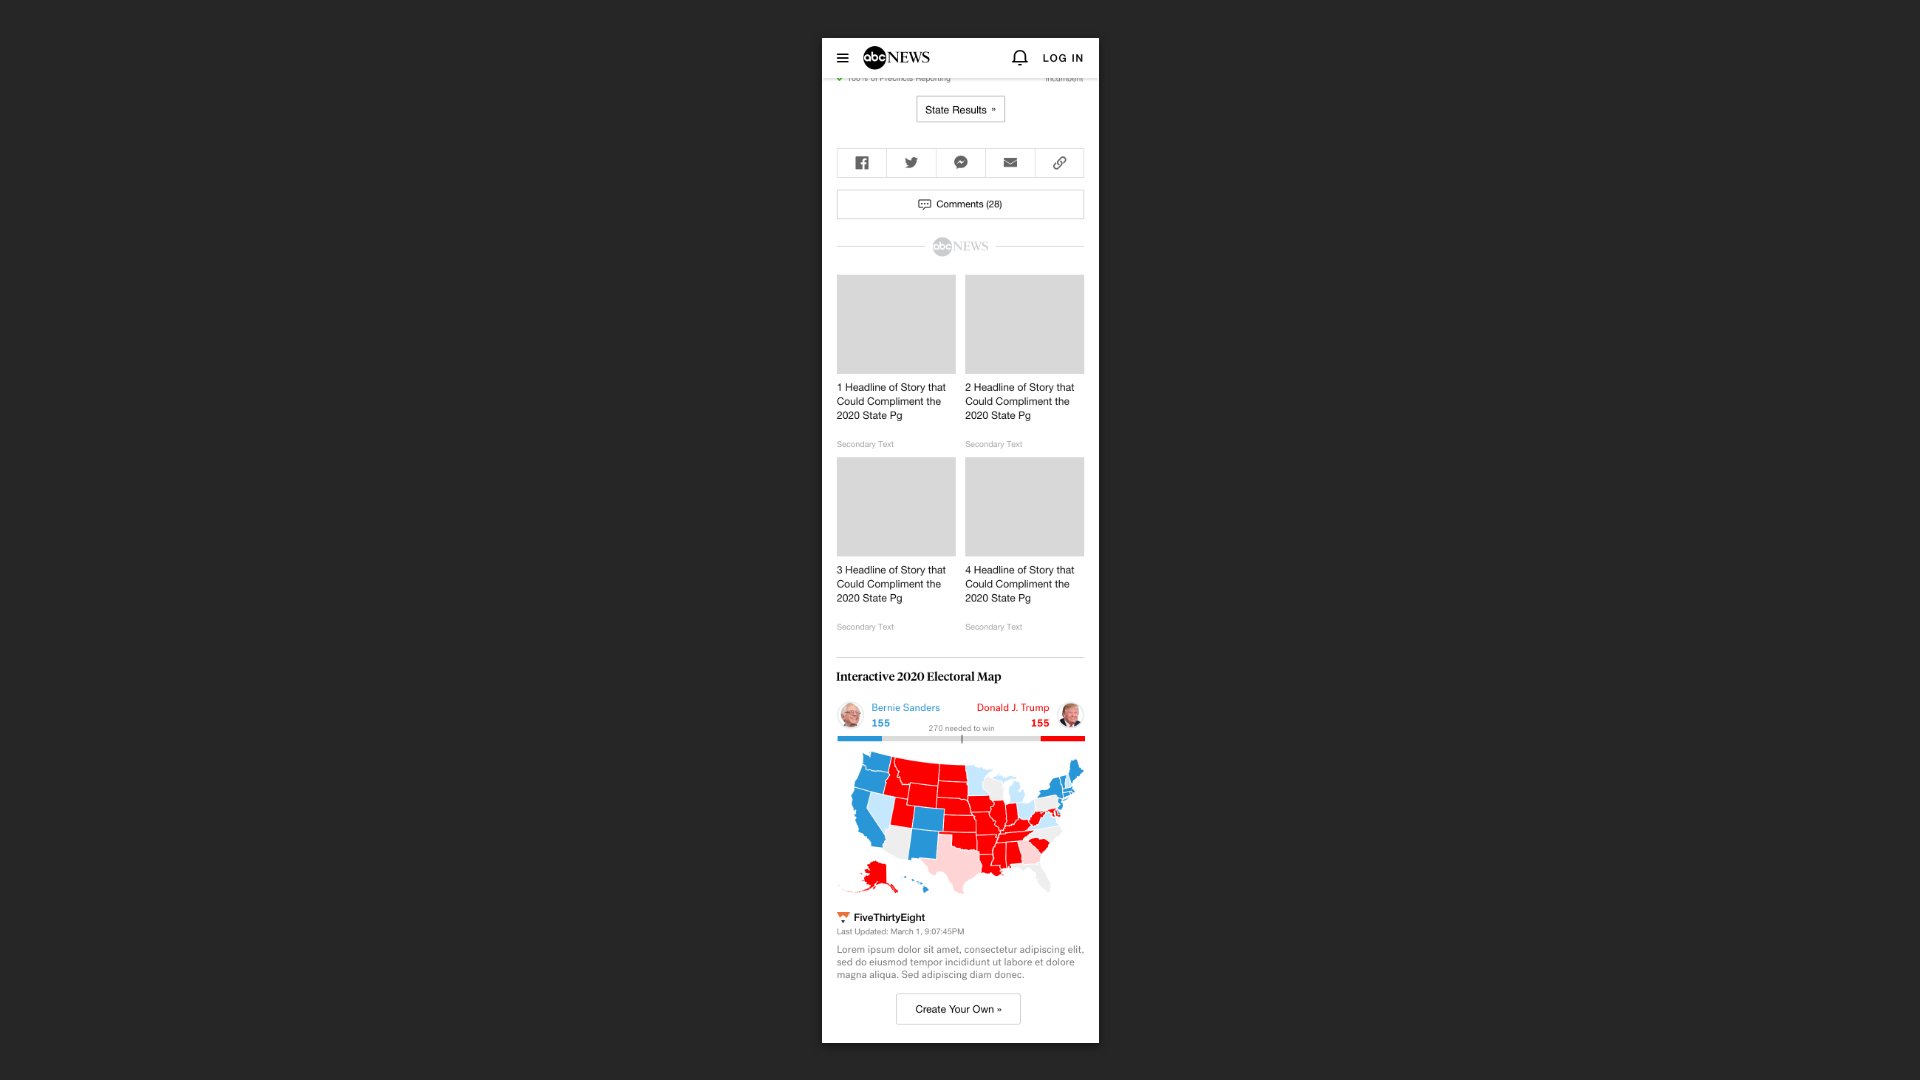
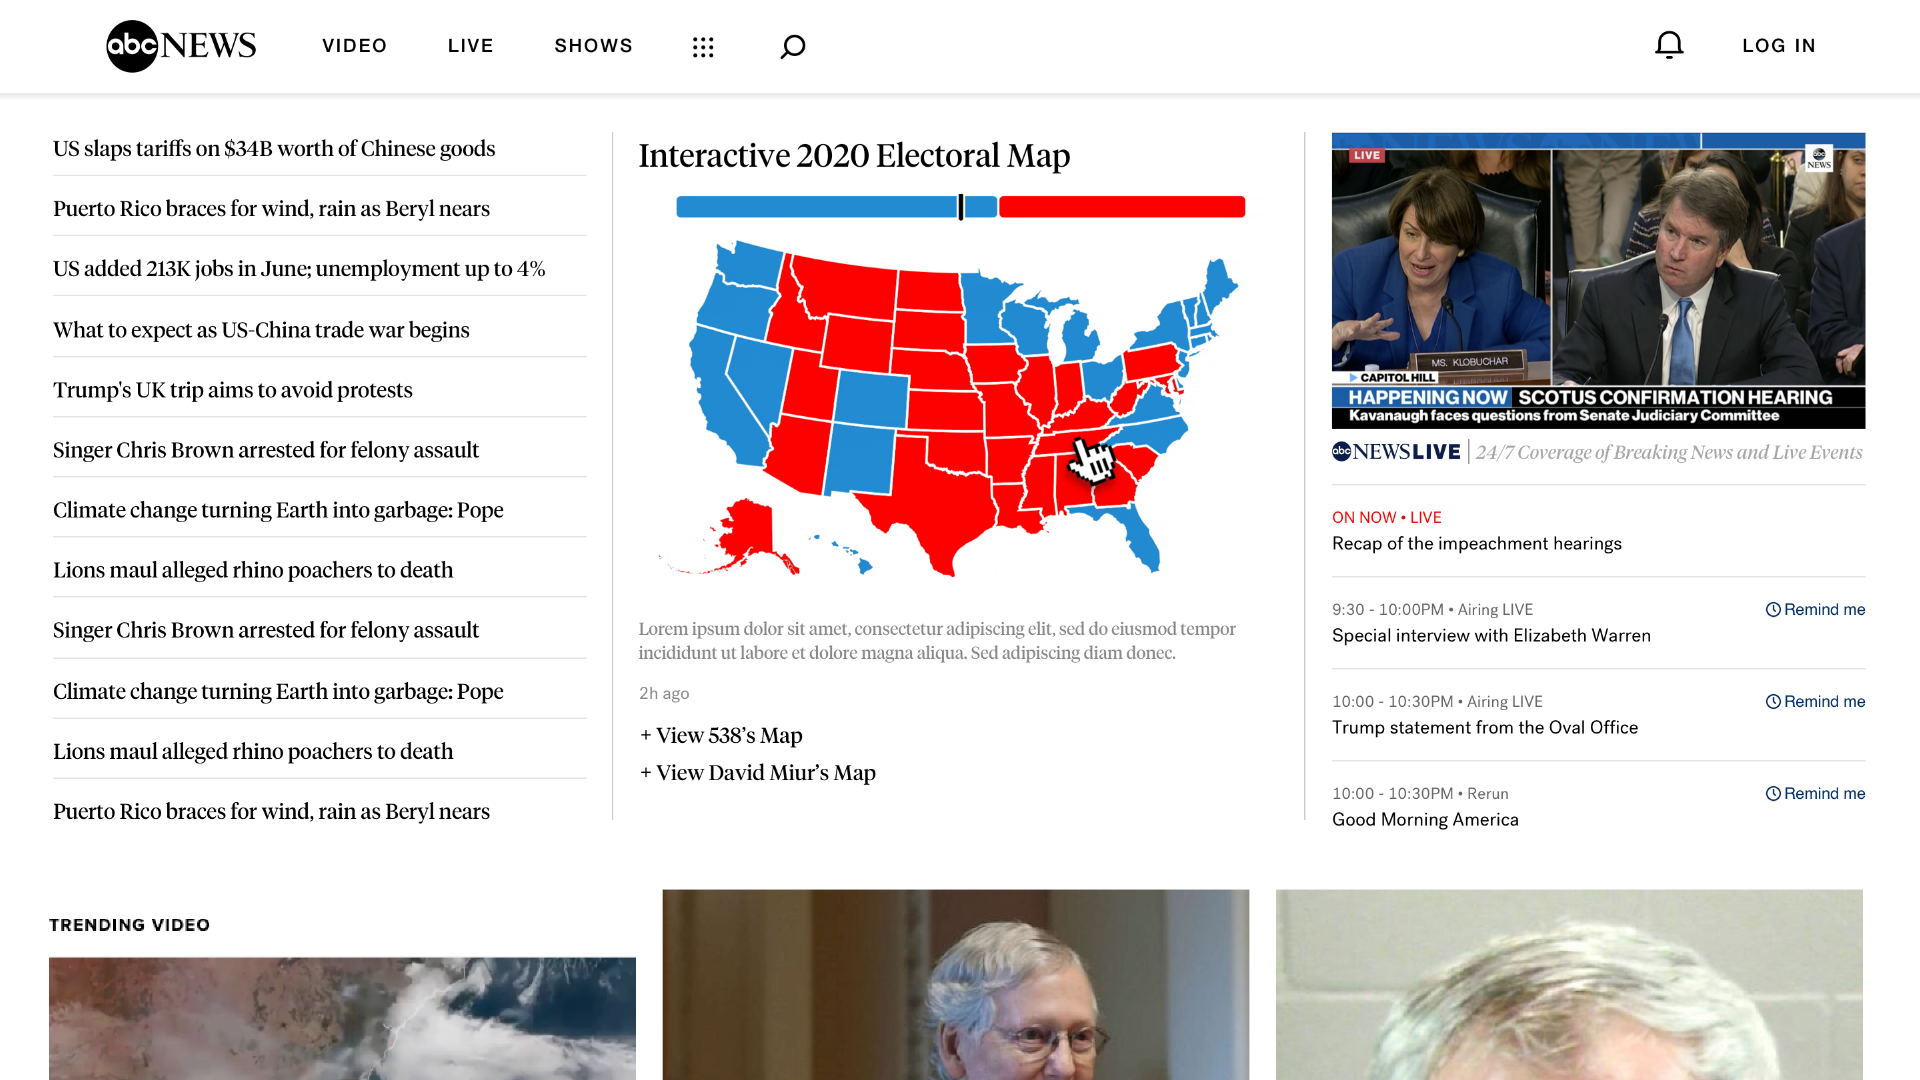
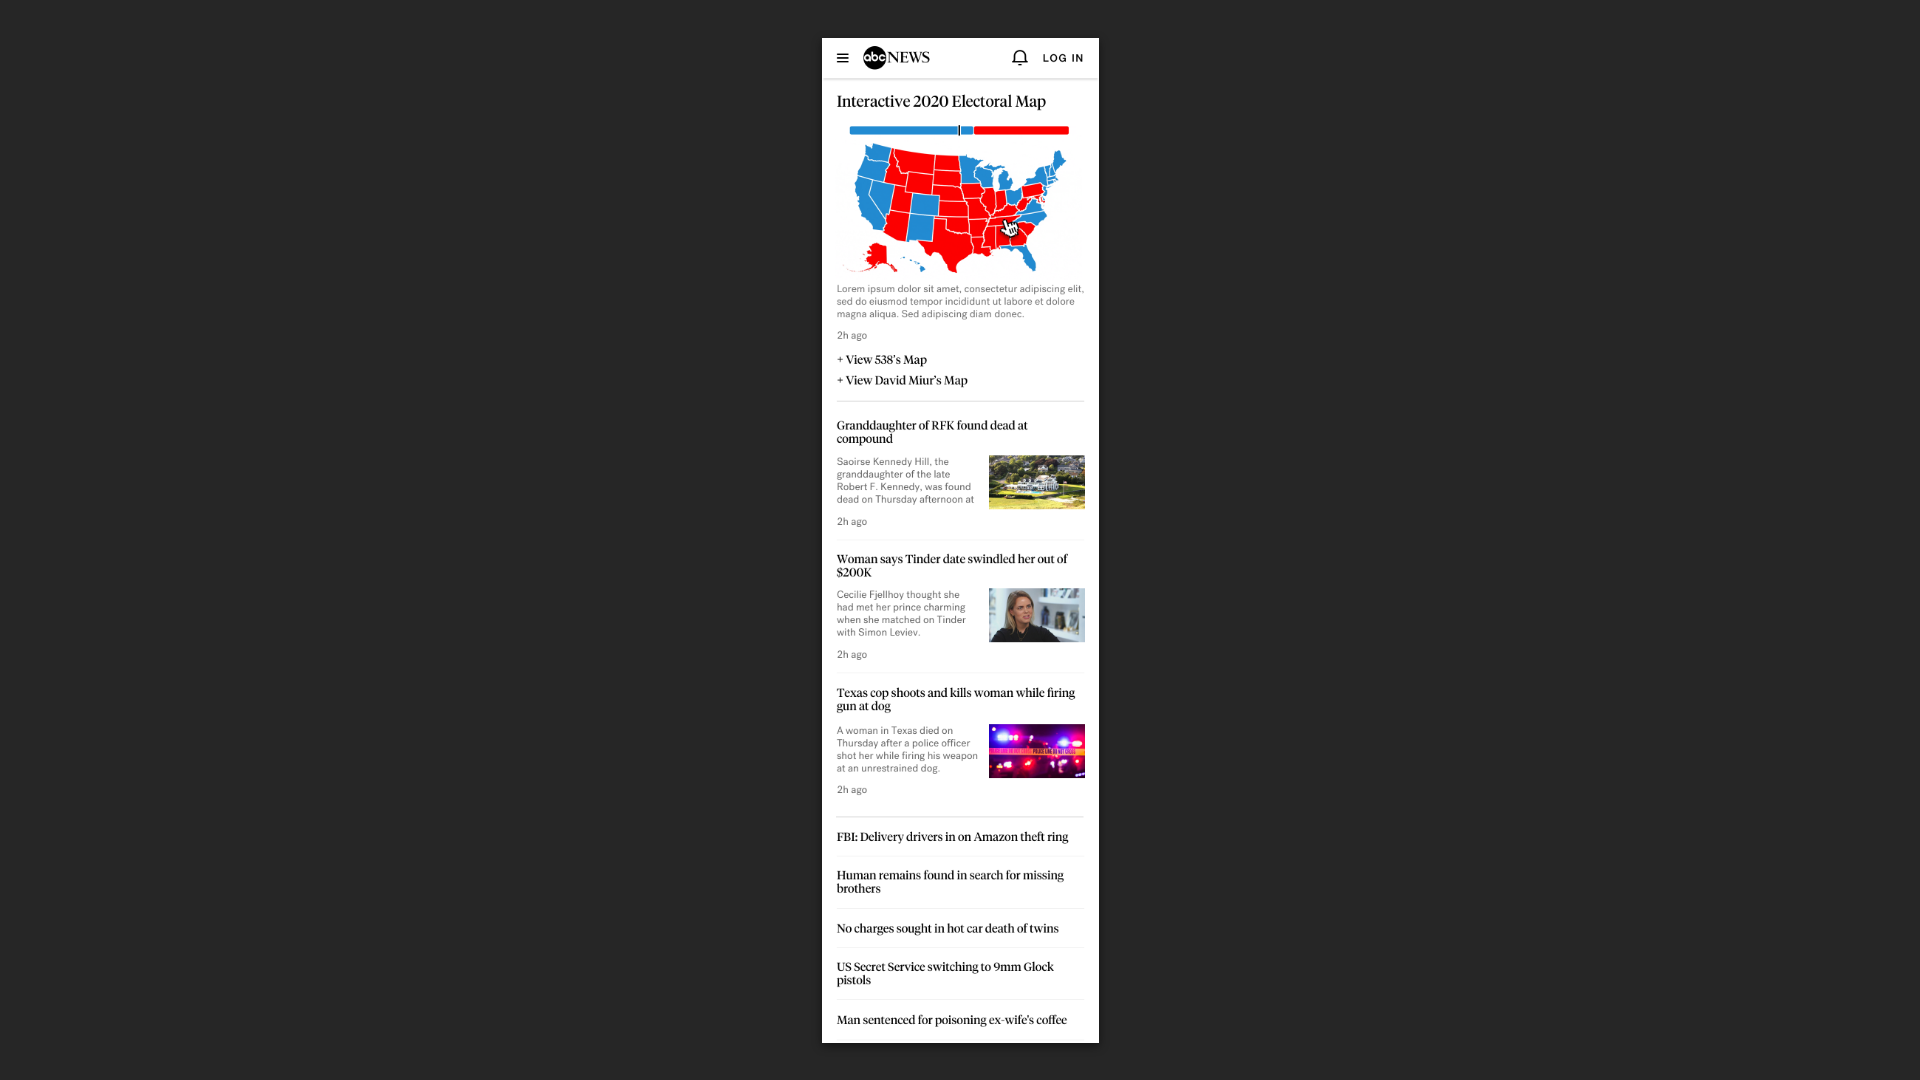
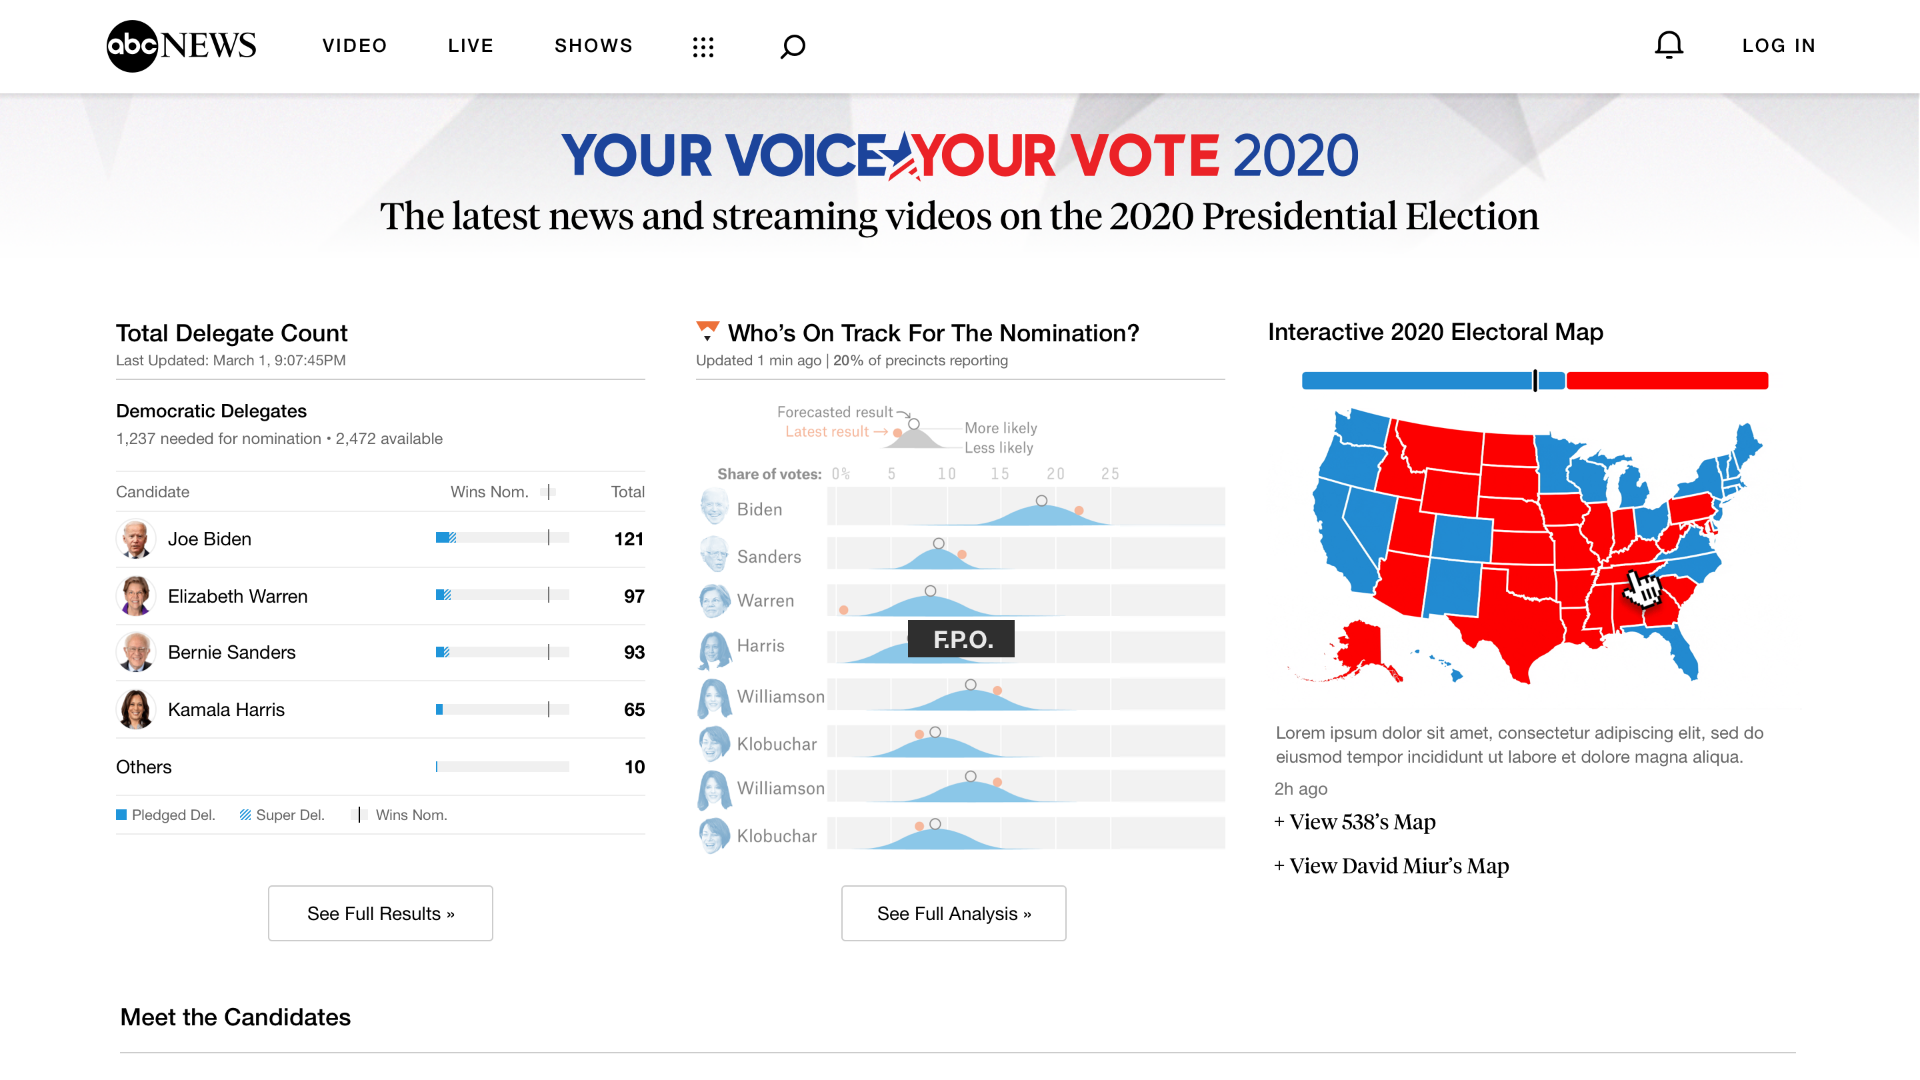
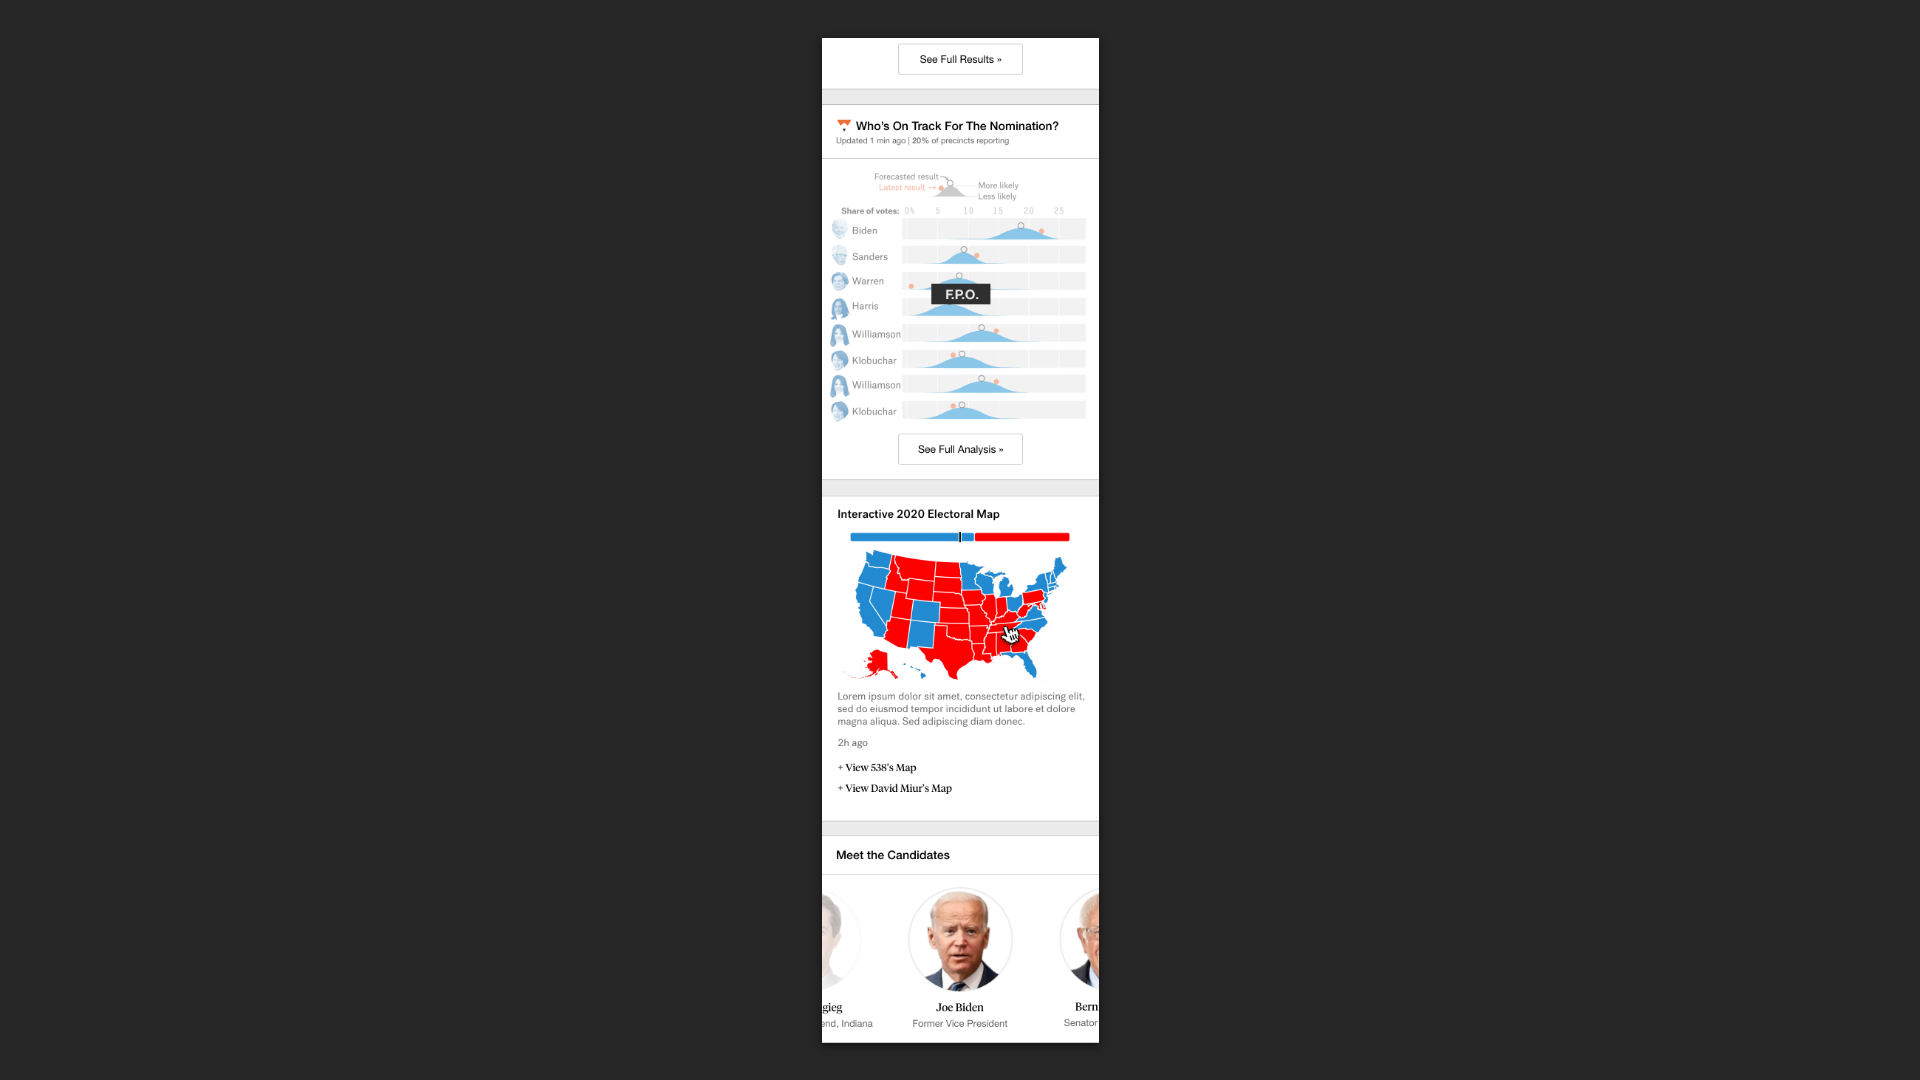
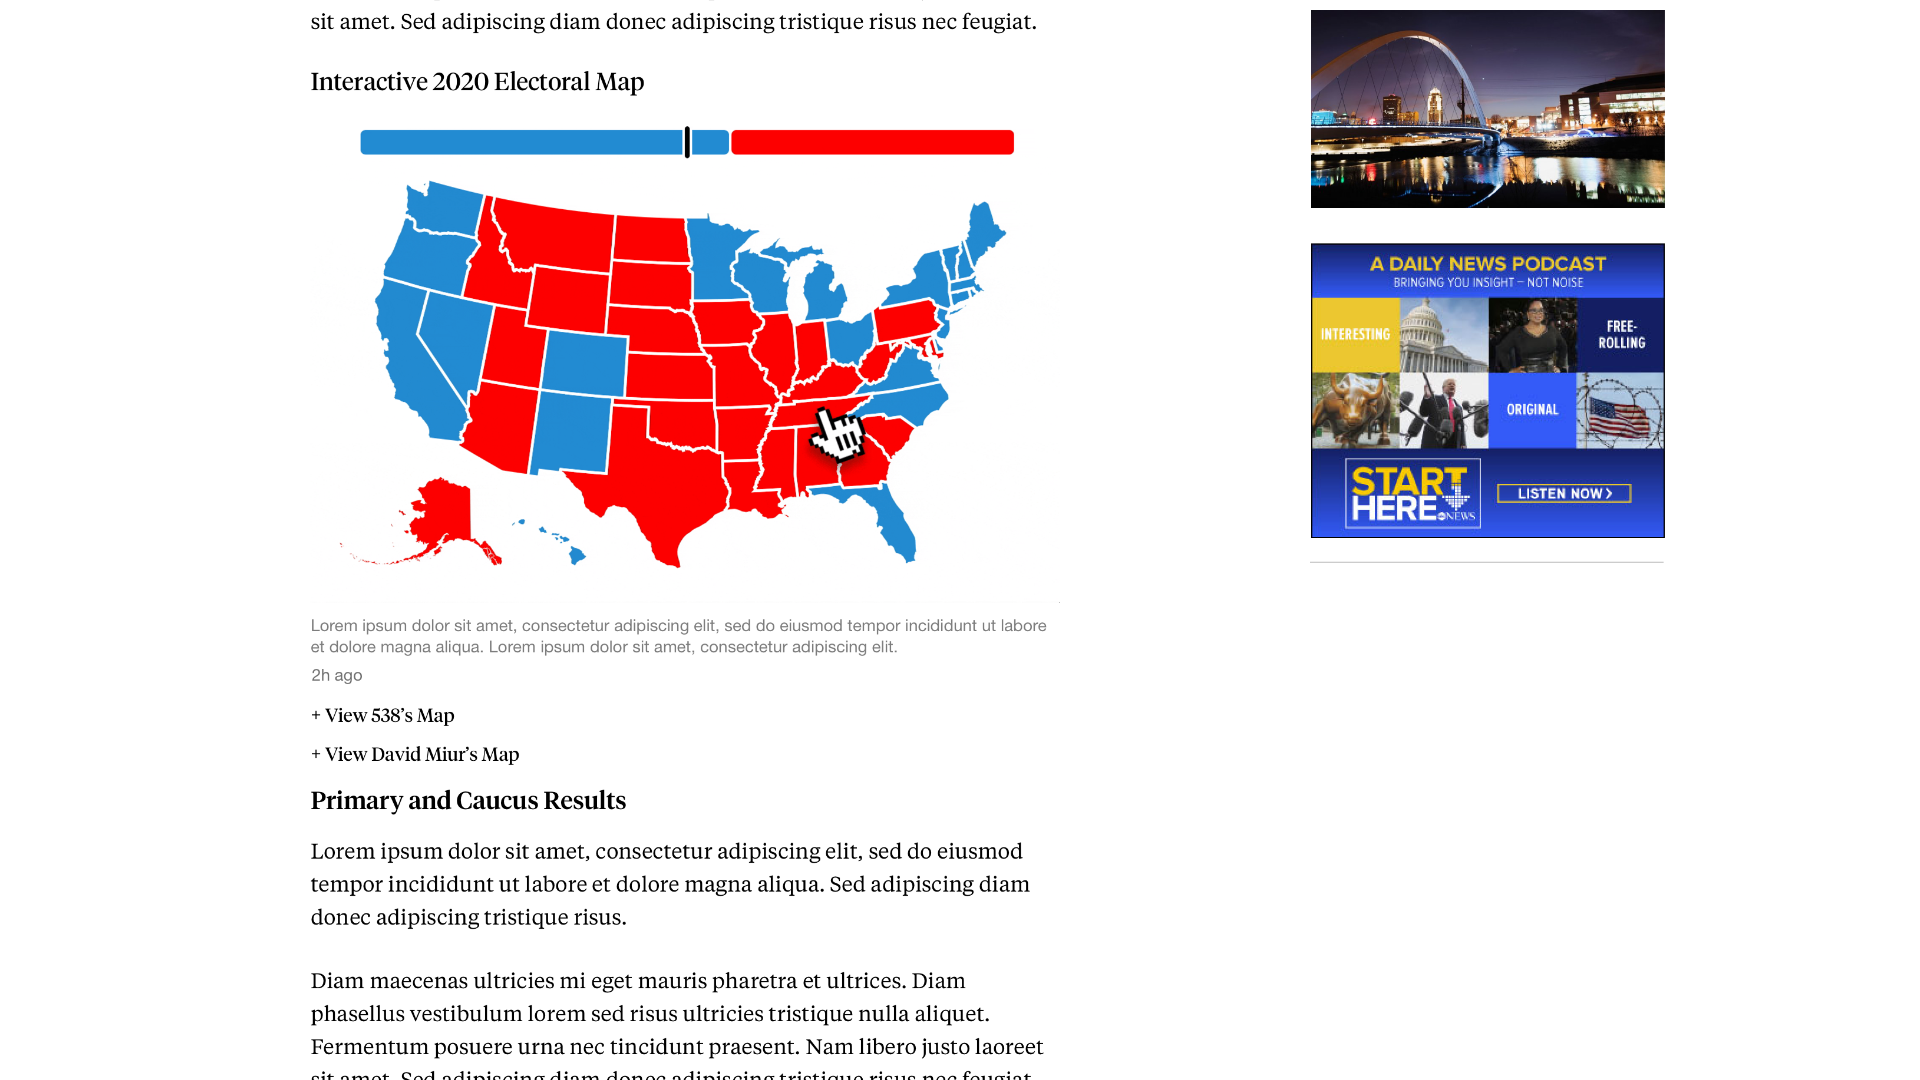
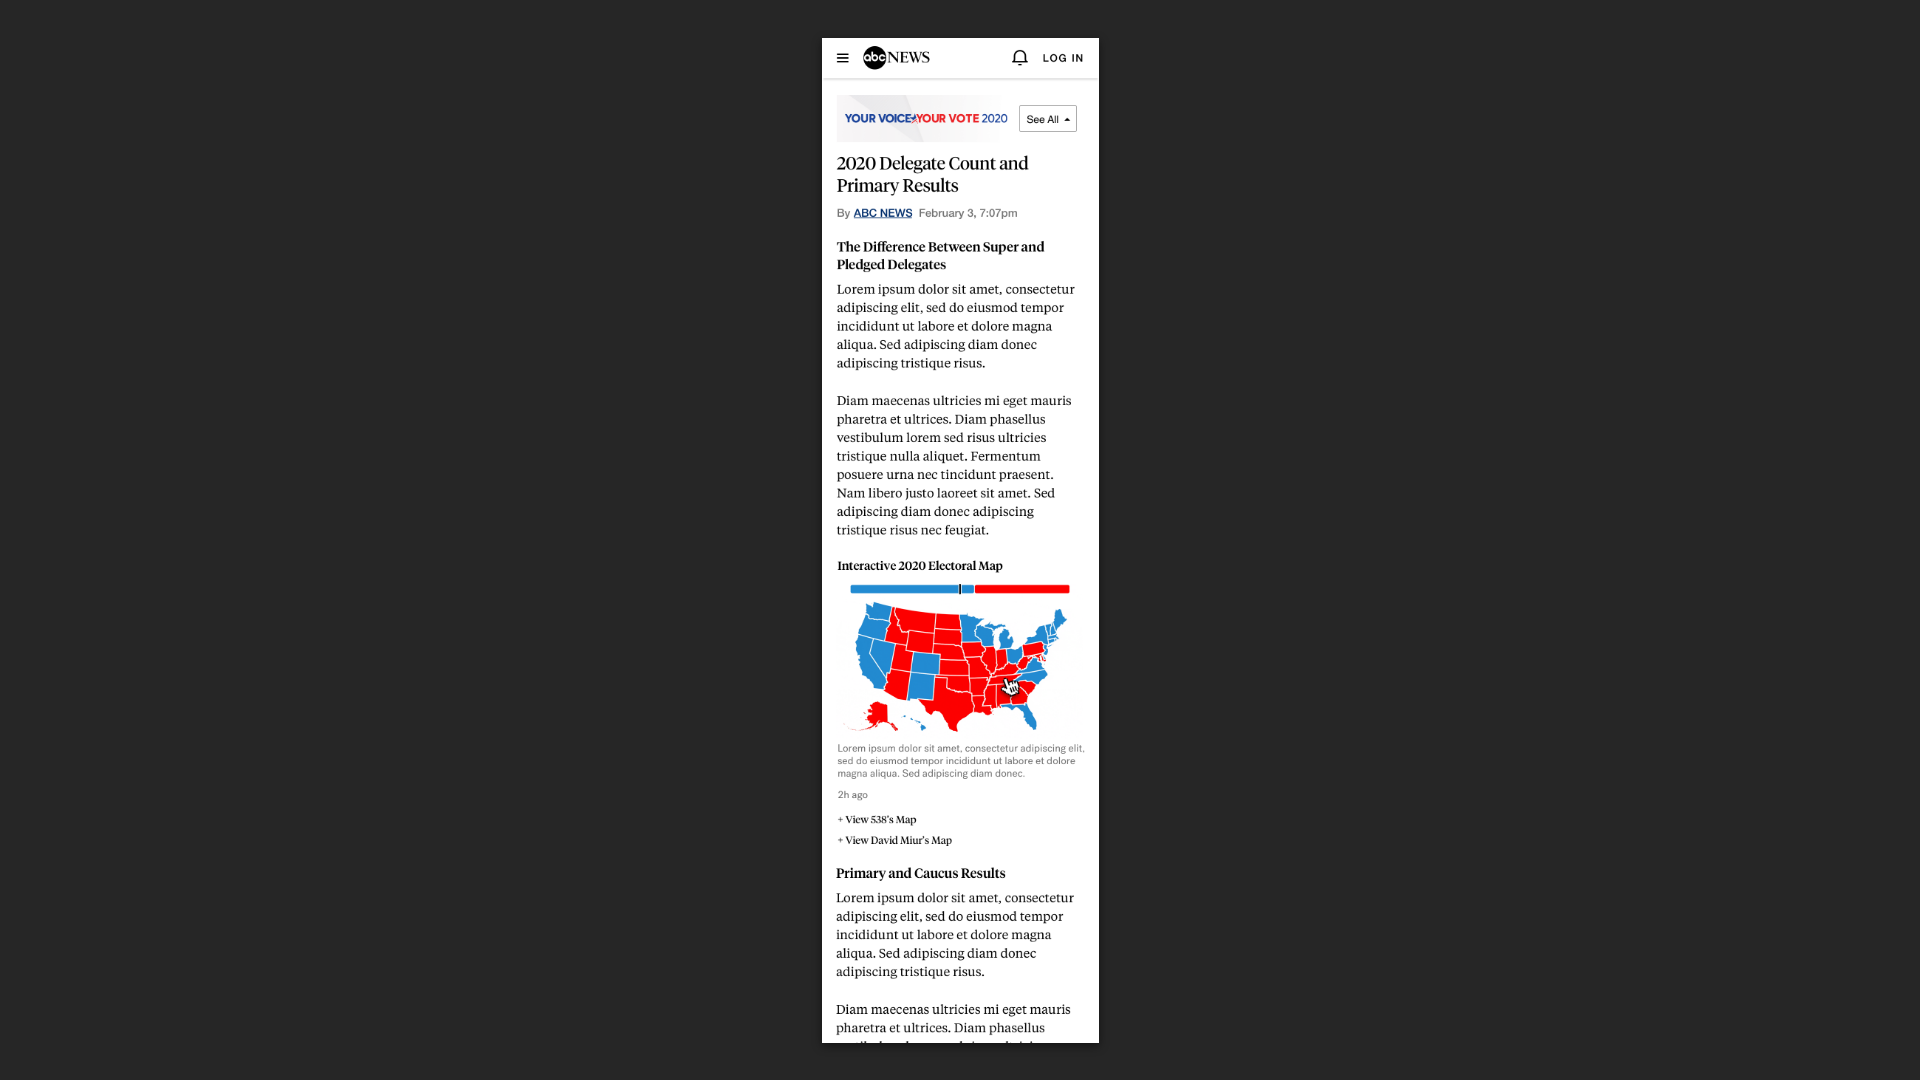
I wanted to attract the user's attention to the interactive map when they land on ABCNews.com
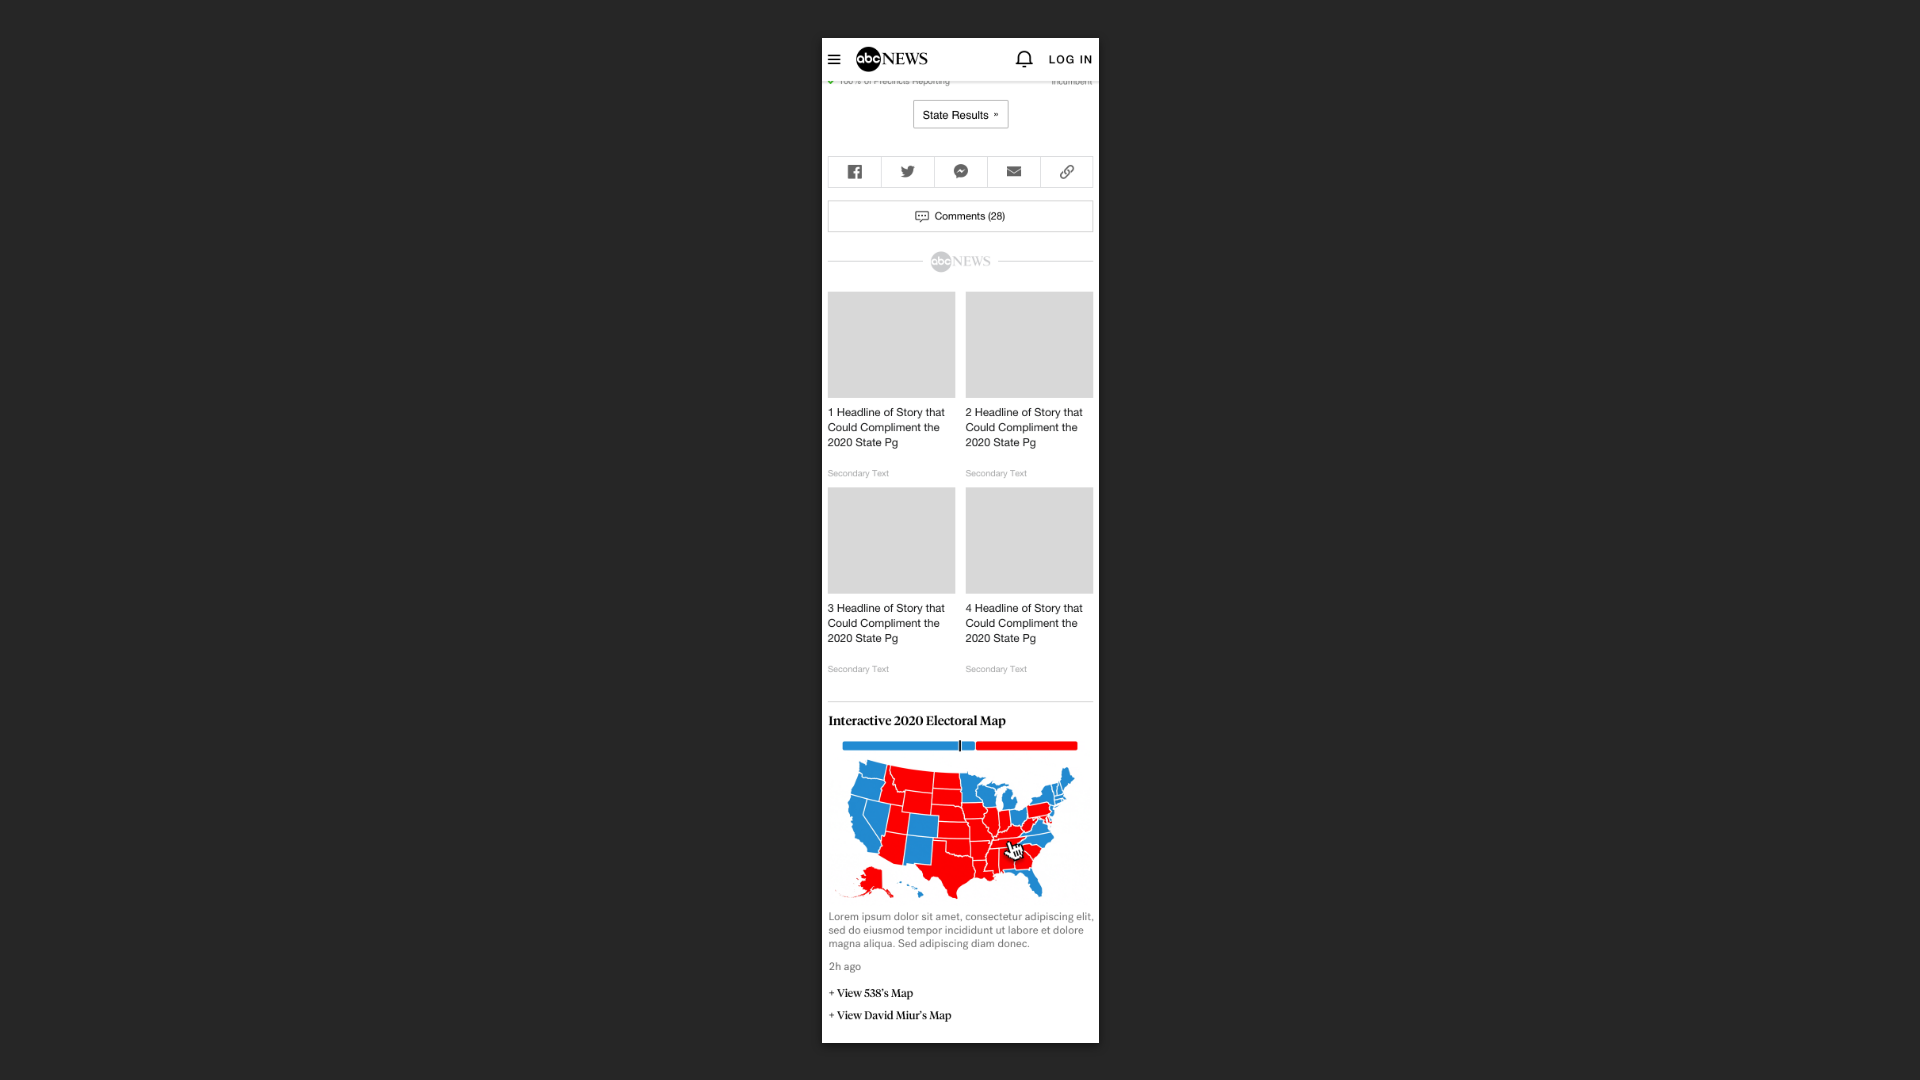
I designed a compact module where the feature can be promoted on any page, responsively.
These would be separated by a branded and general promo module.
These modules can be located on the home page, election index page, article pages, and ad space.
BRANDED MODULES
GENERAL MODULES

USER-FRIENDLY UI
A big focus during our brainstorm of the product was to keep the user interface as user-friendly as possible.
One point I noticed when looking at competitors, such as 270towin, is that the product is difficult to use for mobile users.
Users have to pinch and zoom into the map and tap on each state in order to change the wins.
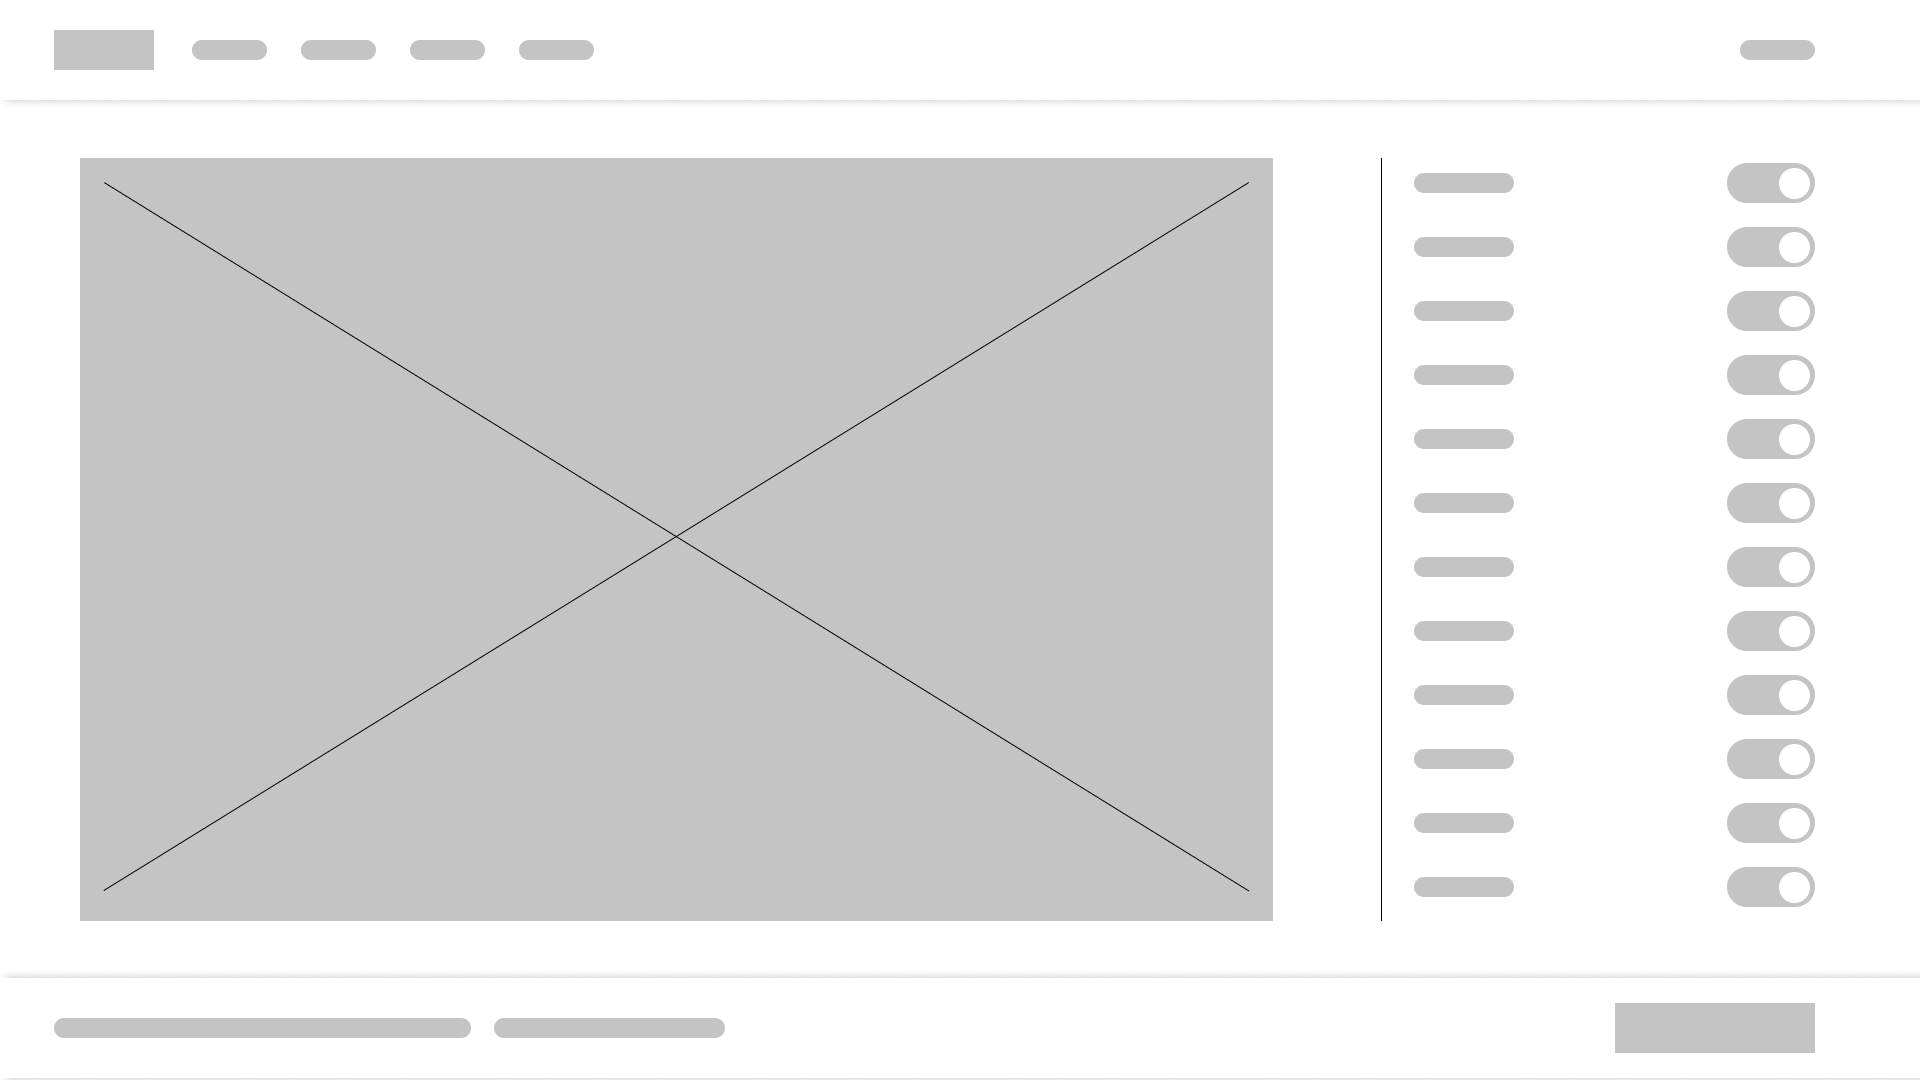
I suggested this toggle button design to allow both desktop and mobile users a secondary action.
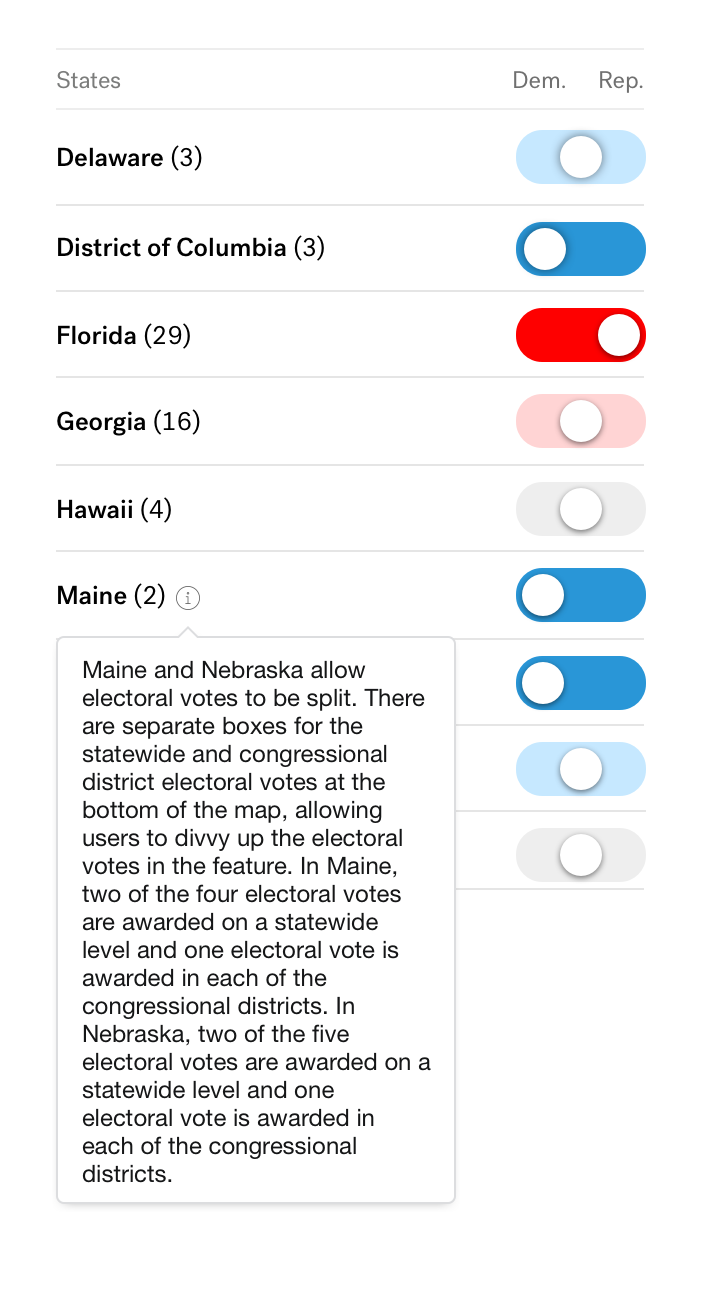
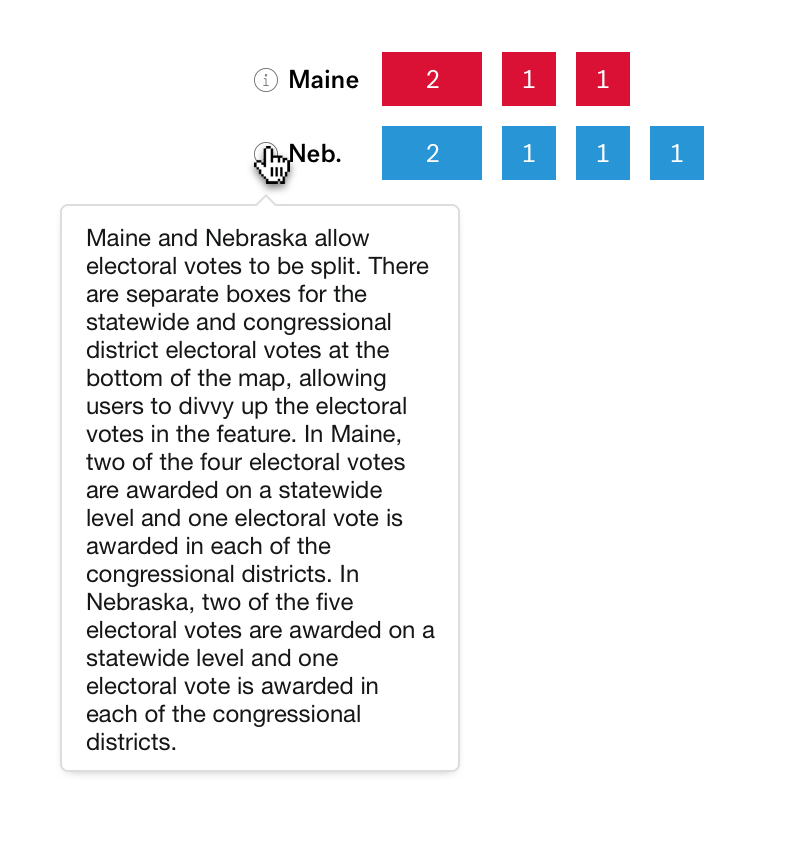
We took into consideration that there could be many users who are unfamiliar with the specifics of the election, such as Maine and Nebraska being states that allow split votes.
DESKTOP USER FLOW
This section shows a high-level overview of the user flow for desktop users.
1.
The user sees the module of the interactive map and clicks it.
3.
Getting started with a blank map or a presets of maps curated by ABC News. Some of these preset examples are from FiveThirtyEight, previous election results, and complete one-sided filled.
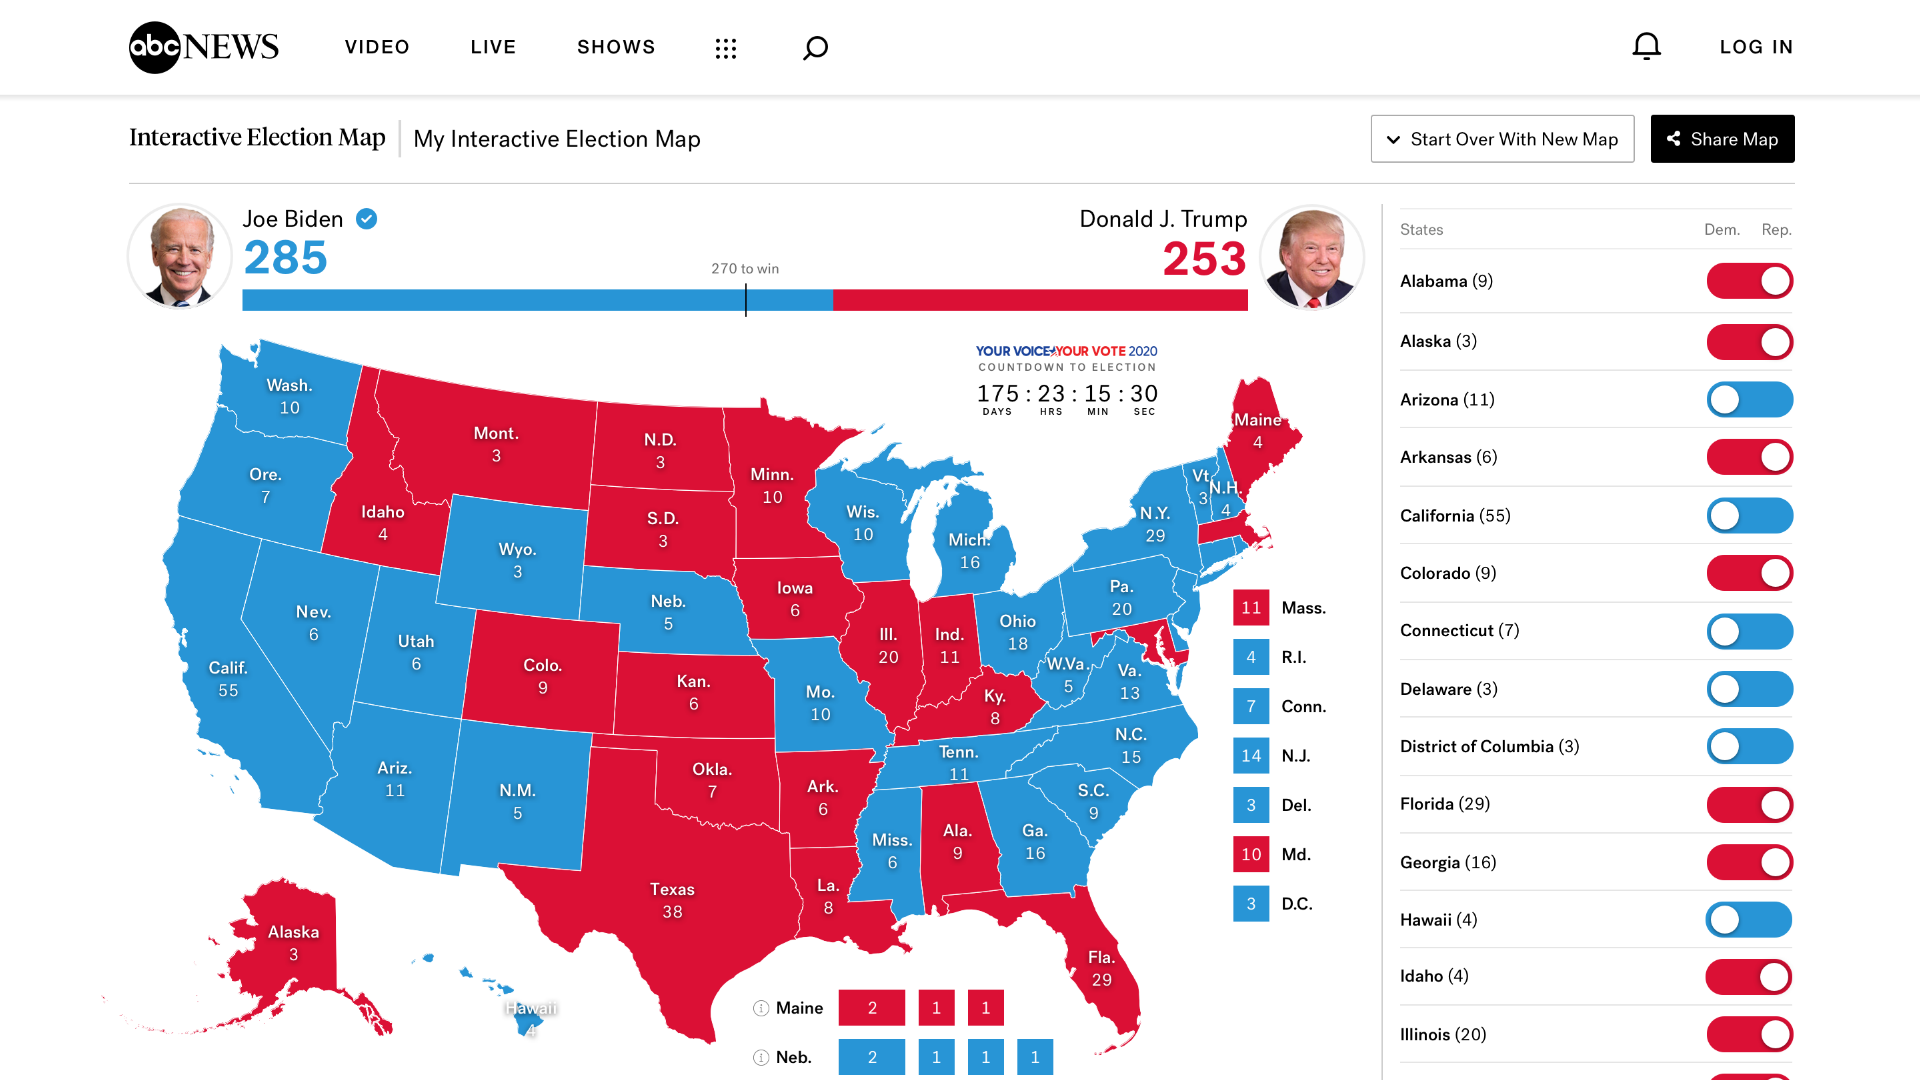
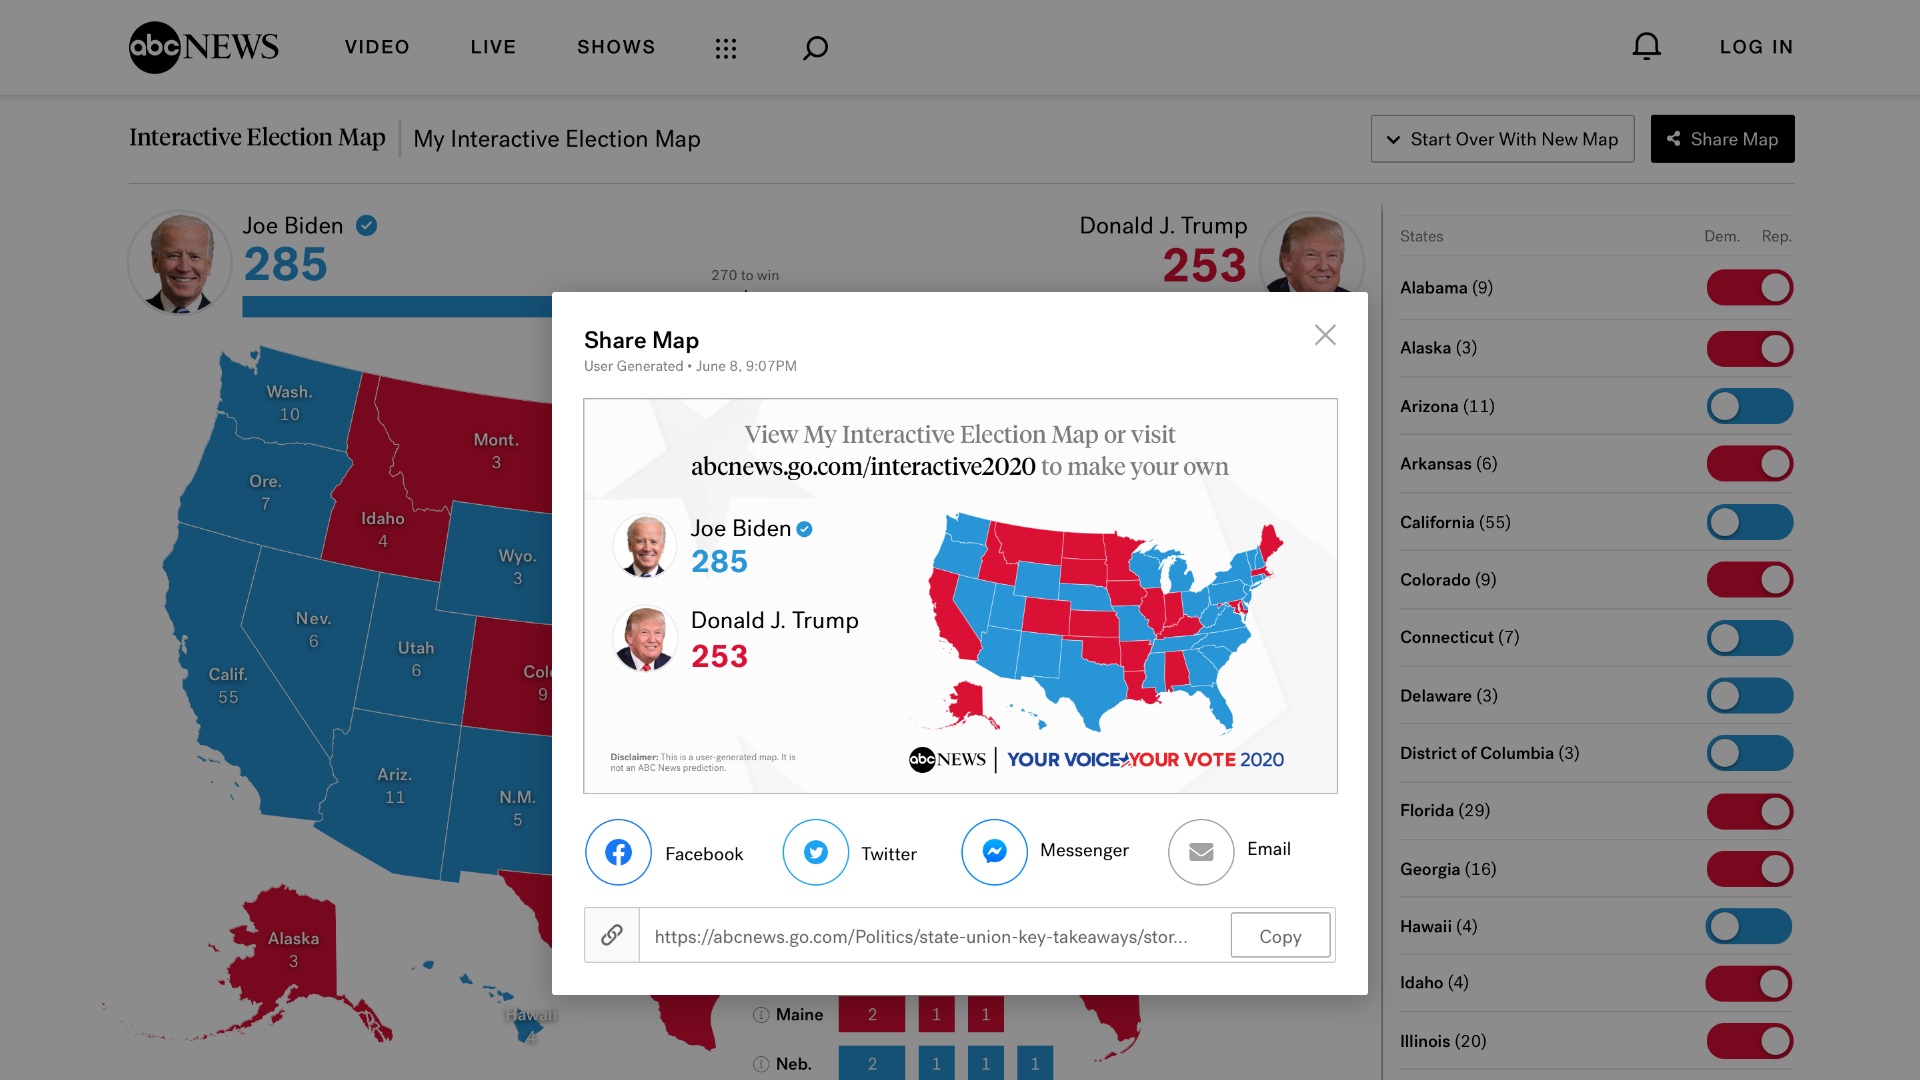
5.
A fully personalized map that has been completed. The share button will expand along with a tooltip popup to notify the user their map can be shared with their friends.
2.
The landing page of the map. Provides a quick description to users of what it is by keeping it short and concise.
4.
Users interact with the map by toggling the buttons on the right column or directly clicking on the states on the map to adjust the "Balance of Power" (indicates which side is currently winning).
6.
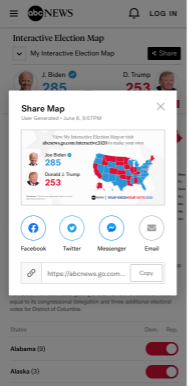
Users can then share their personalized map through different social media platforms.
MOBILE USER FLOW
This section shows a high-level overview of the user flow for mobile users and how it differs from desktop.
1.
The user sees the module of the interactive map and clicks it.
3.
Getting started with a blank map or a presets of maps curated by ABC News. On mobile, there is no preview of the maps.
5.
A fully personalized map that has been completed. The share button will expand.
2.
The landing page of the map. Provides a quick description to users of what it is by keeping it short and concise.
4.
Users interact with the map by toggling the buttons below the map.
Our focus was to provide an easier experience for users since mobile has less real estate than desktop.
Users still have the additional ability to pinch and zoom into the map and toggle colors should they choose to do so.
6.
Users can then share their personalized map through different social media platforms.
FINAL PRODUCT
OVERVIEW
In preparation for the 2020 Election, our team designed a product webpage for our users to be able to keep track of the reporting of votes and other election-related news in real-time. For this project, we created a new suite of map products for national, state, and local, county and exit polls, race rating tables, a curated key races to watch experience, state-level results pages, and a live blog for web and mobile. The feature set was showcased in a home page takeover experience during the primaries and caucuses, general election, and election night for the 2020 Election.
This section will specifically be dedicated to the map portion of the product. All other features and design work can be view on the Election 2020 project page, link found below.
Team
2 Dedicated Designers (me)
Product
Engineering
Tools
Sketch
Abstract
Duration
5 months
Jun 2020 — Oct 2020
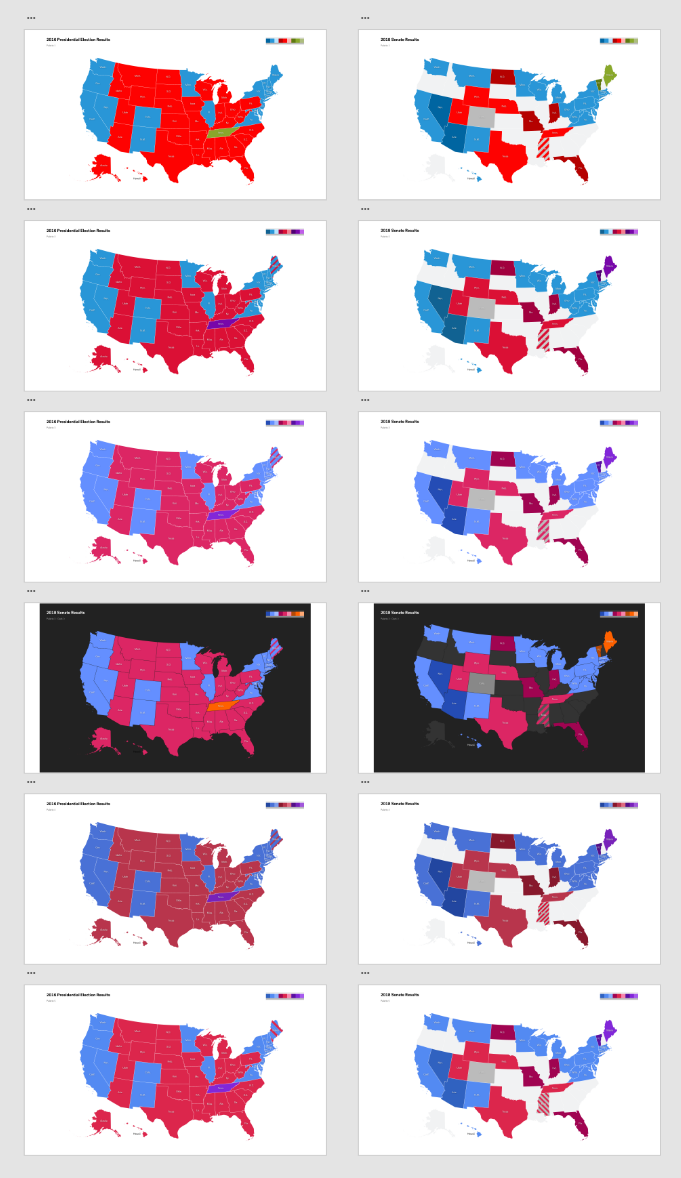
COLOR MAPPING
A large part of our scope was deciding the new colors to be used for the upcoming election.
We tested different combinations and as well as compared to previous 2016 and 2018 elections map color usages.
An important factor was deciding the color variation between when a party is leading, winning, and gain.
The colors should be similar but distinct enough that users can tell them apart.
These colors were also tested for protanopia (red), deuteranopia (green), and tritanopia (blue & yellow) accessibility.
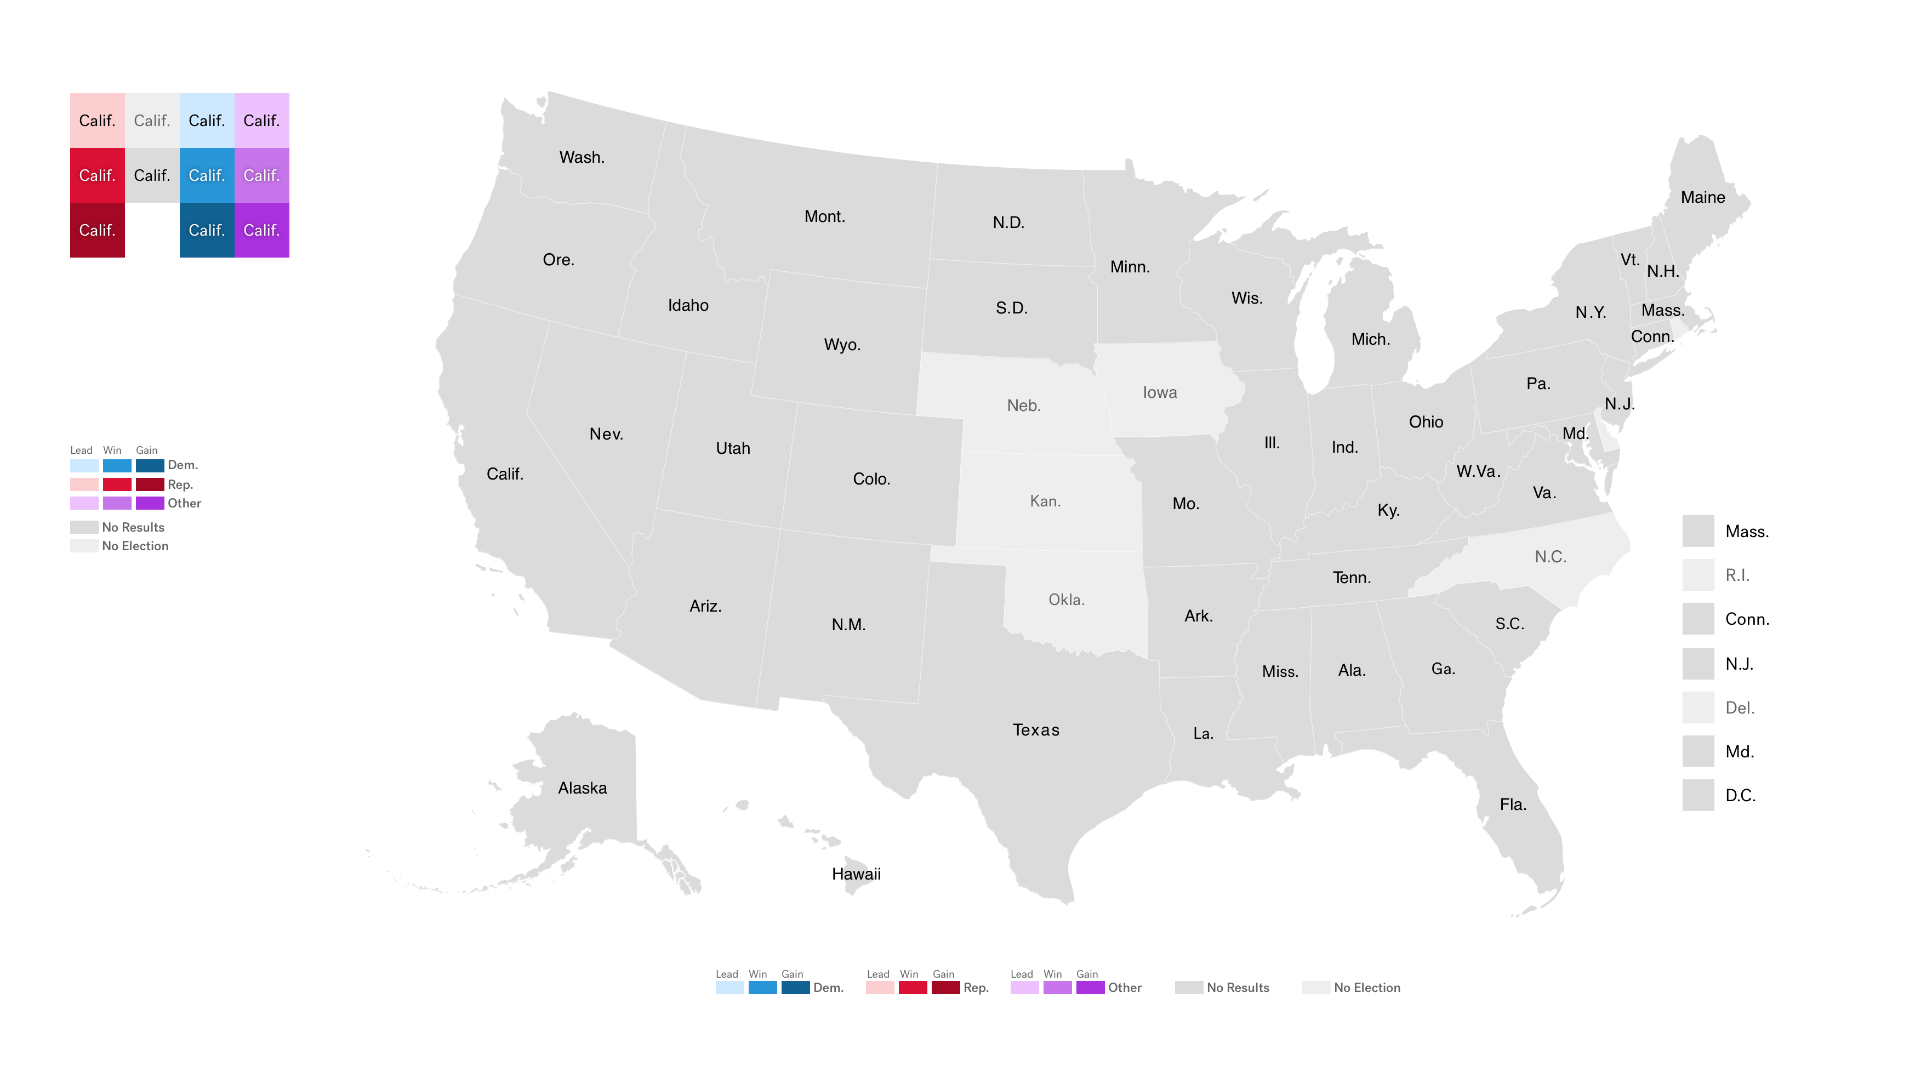
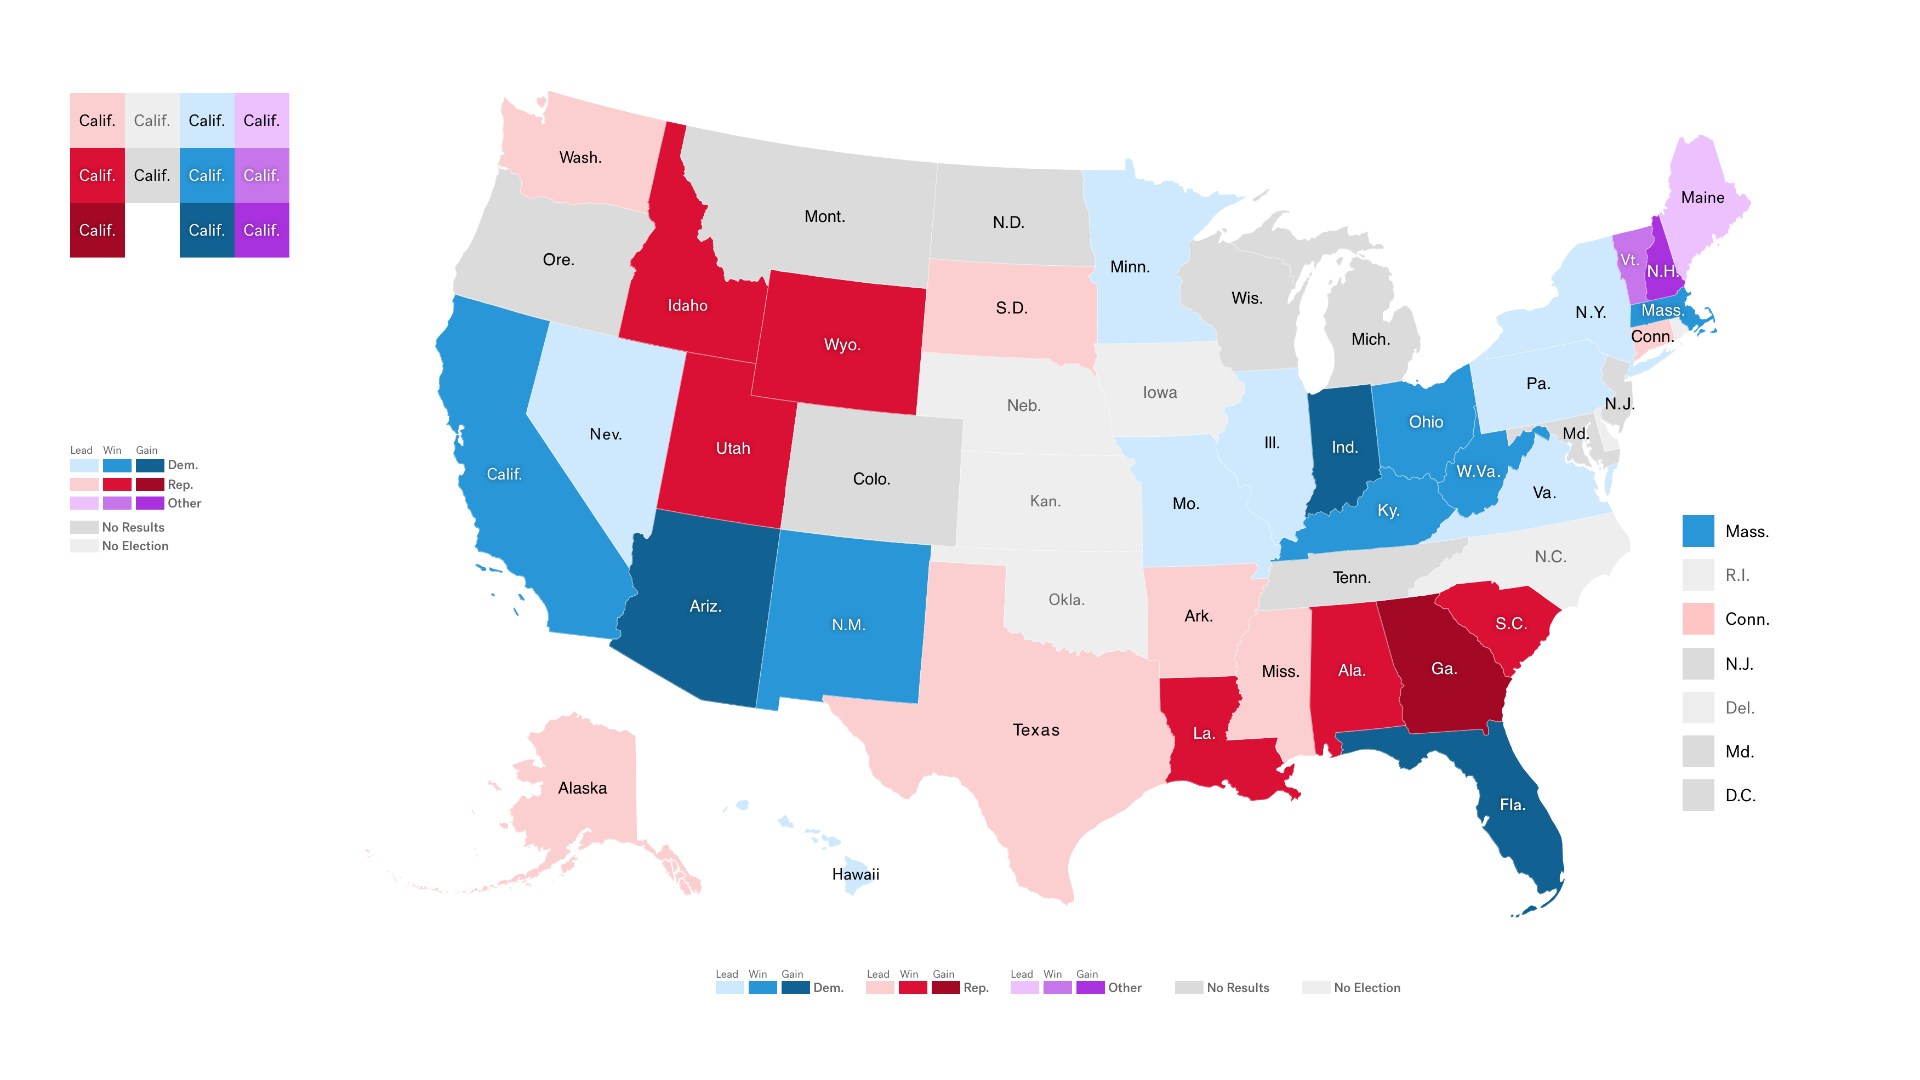
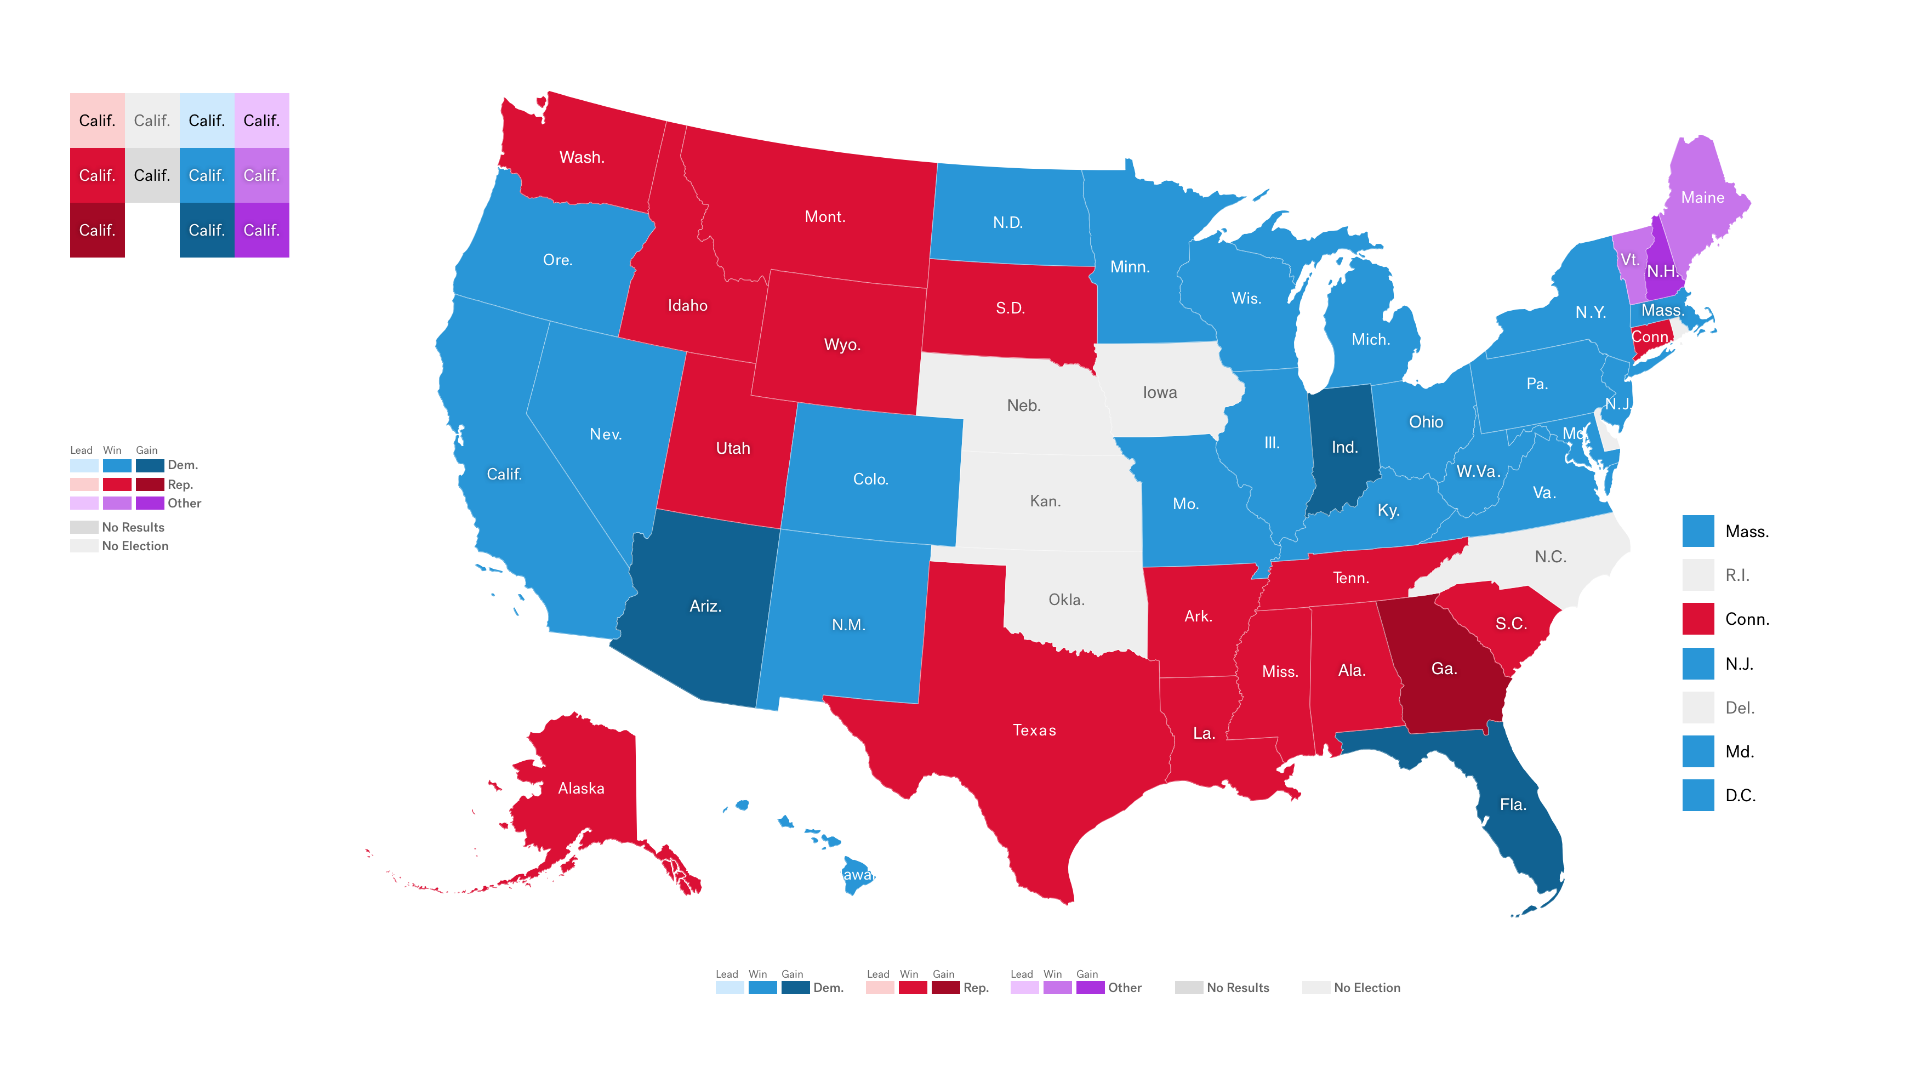
COLOR MAPPING PT. 2
Throughout the election, there will be three main visuals that the map will look like.
The first state is "before", where voting has not been reported yet and the states should be shown as "no results" or "no election" if there isn't one being held.
The second state is "during", in which voting has started throughout the country. As voting reports come in, the states will assimilate the different colors based on the results.
When a party is leading for a state, the color will be shown as the pastel shade of the party (e.g. blue, red, purple).
When a party has won the state with no change from the previous election, then the state will be shown a slightly darker shade of color.
When a party has won the state with a change from the previous election, then the state will be shown with a darker shade of color. This would represent that the state has flipped.
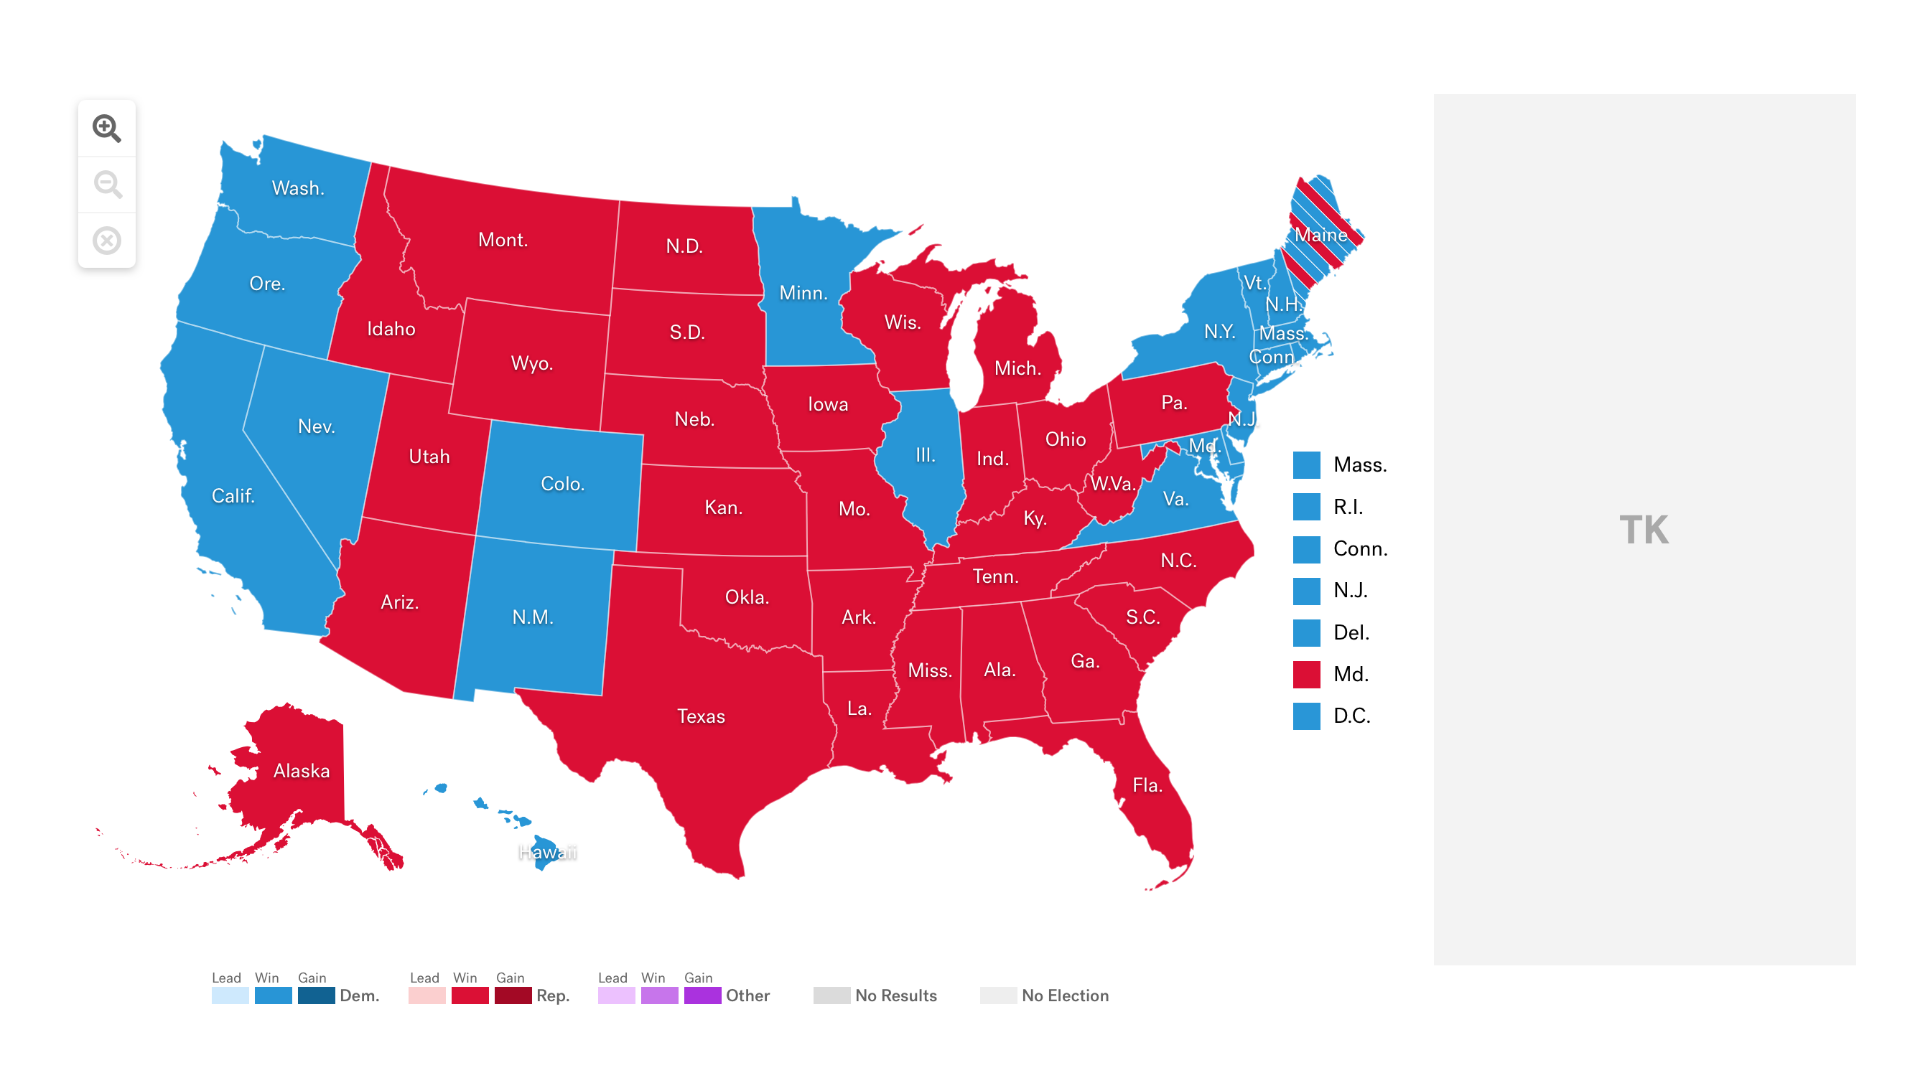
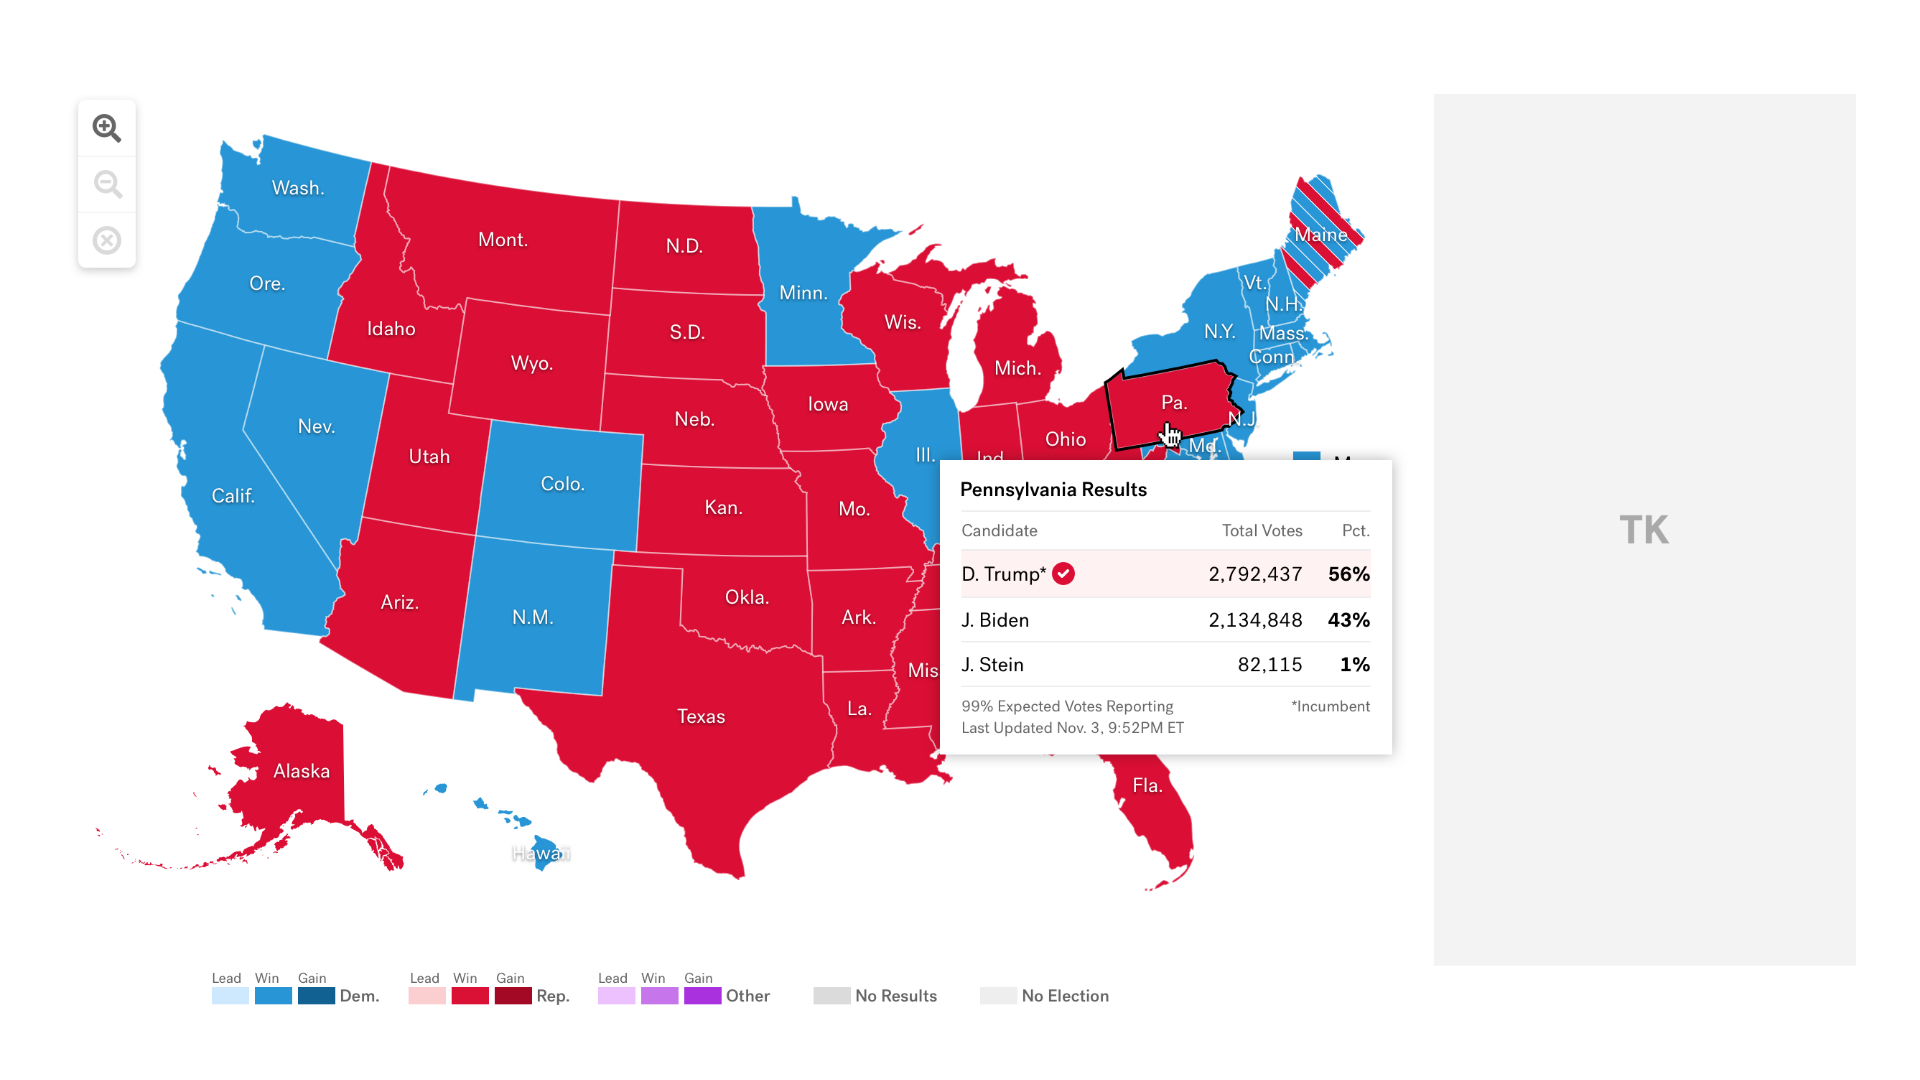
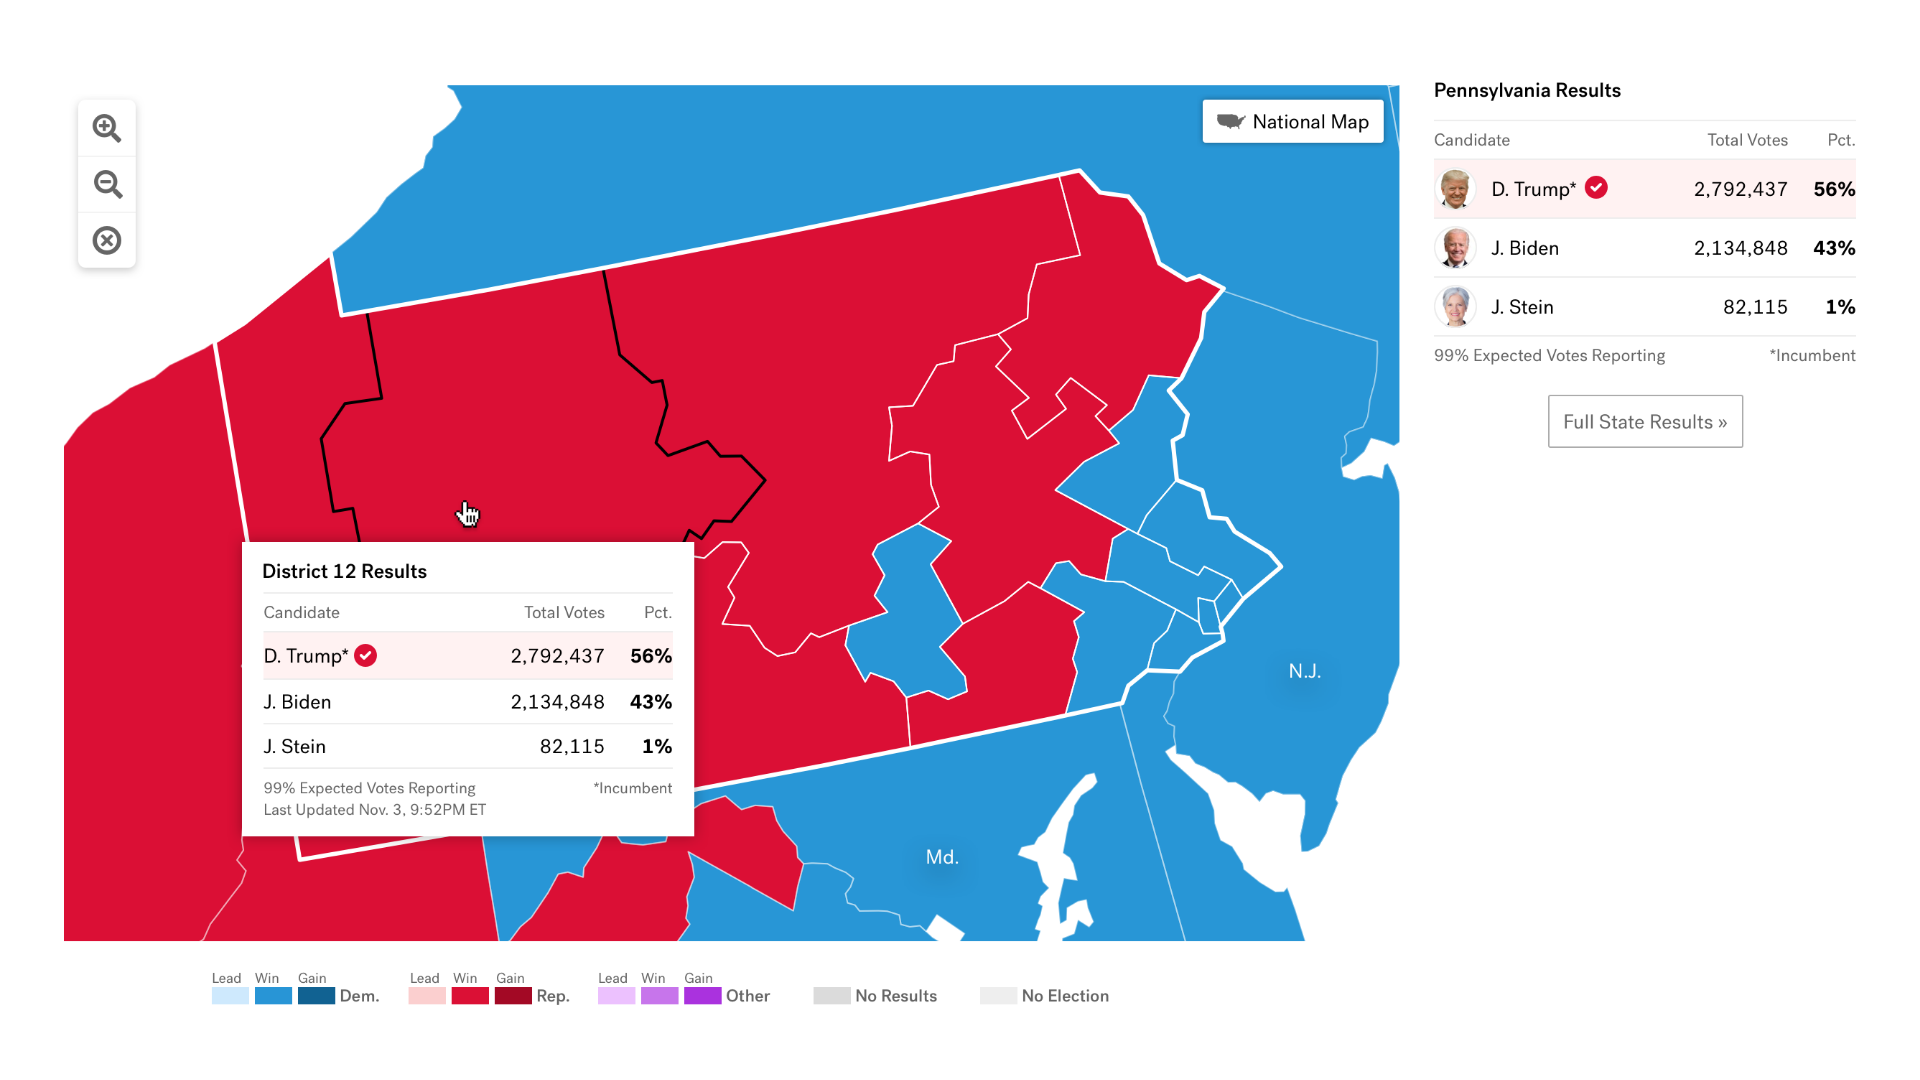
USER INTERACTION - DESKTOP
We laid out the foundation of the map on how it interacts with the users. Keeping in mind that the interaction between a user on desktop and a user on mobile is different.
On desktop - when a user hovers their mouse over a state, a pop-up/hovercard, will appear and display the information of the state. The mouse will also show a black outline of the state to add another level of indication.
If the user wanted to learn more about the state and proceeds to click on it. The map will zoom the user in and display the county or district (depending on the election).
On the right-hand side of the map, users can see the state-wide results while still being able to hover over the county or district for those specific levels of information.
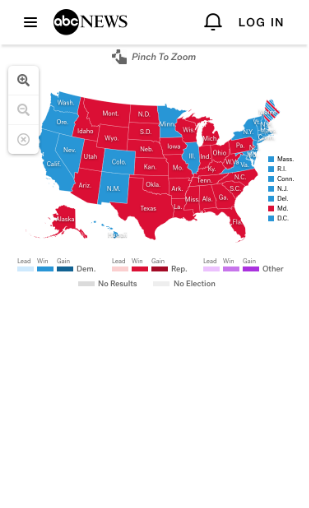
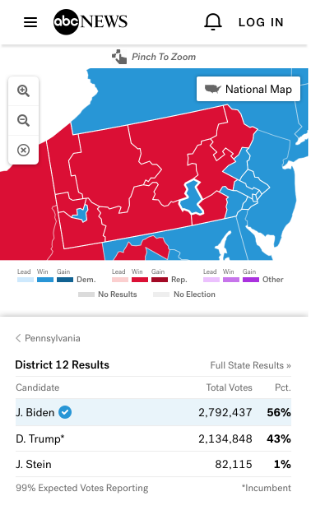
USER INTERACTION - MOBILE
For mobile, the biggest issue is that users aren't able to hover over the states and see the information pop-up.
Due to the compact real-estate of mobile and the nature of touch screens - we had to come up with a solution for mobile users.
Our solution was to let users select the state they want to view and the map will still take the users to the selected state. We took the design of the hovercard and re-purposed it to have it display at the bottom of the mobile screen.
HOVER CARD UI
We designed different scenarios of information that could be displayed in the hovercard UI.
These include:
"On State Hover", when users are on the national map view.
"On District Hover", when users are zoomed into the state view.
"No Election" and "Polls Close" situations.
Different results are also designed. For example, if there are split votes for states such as Maine and Nebraska. Or if there are 2 seats up for election.
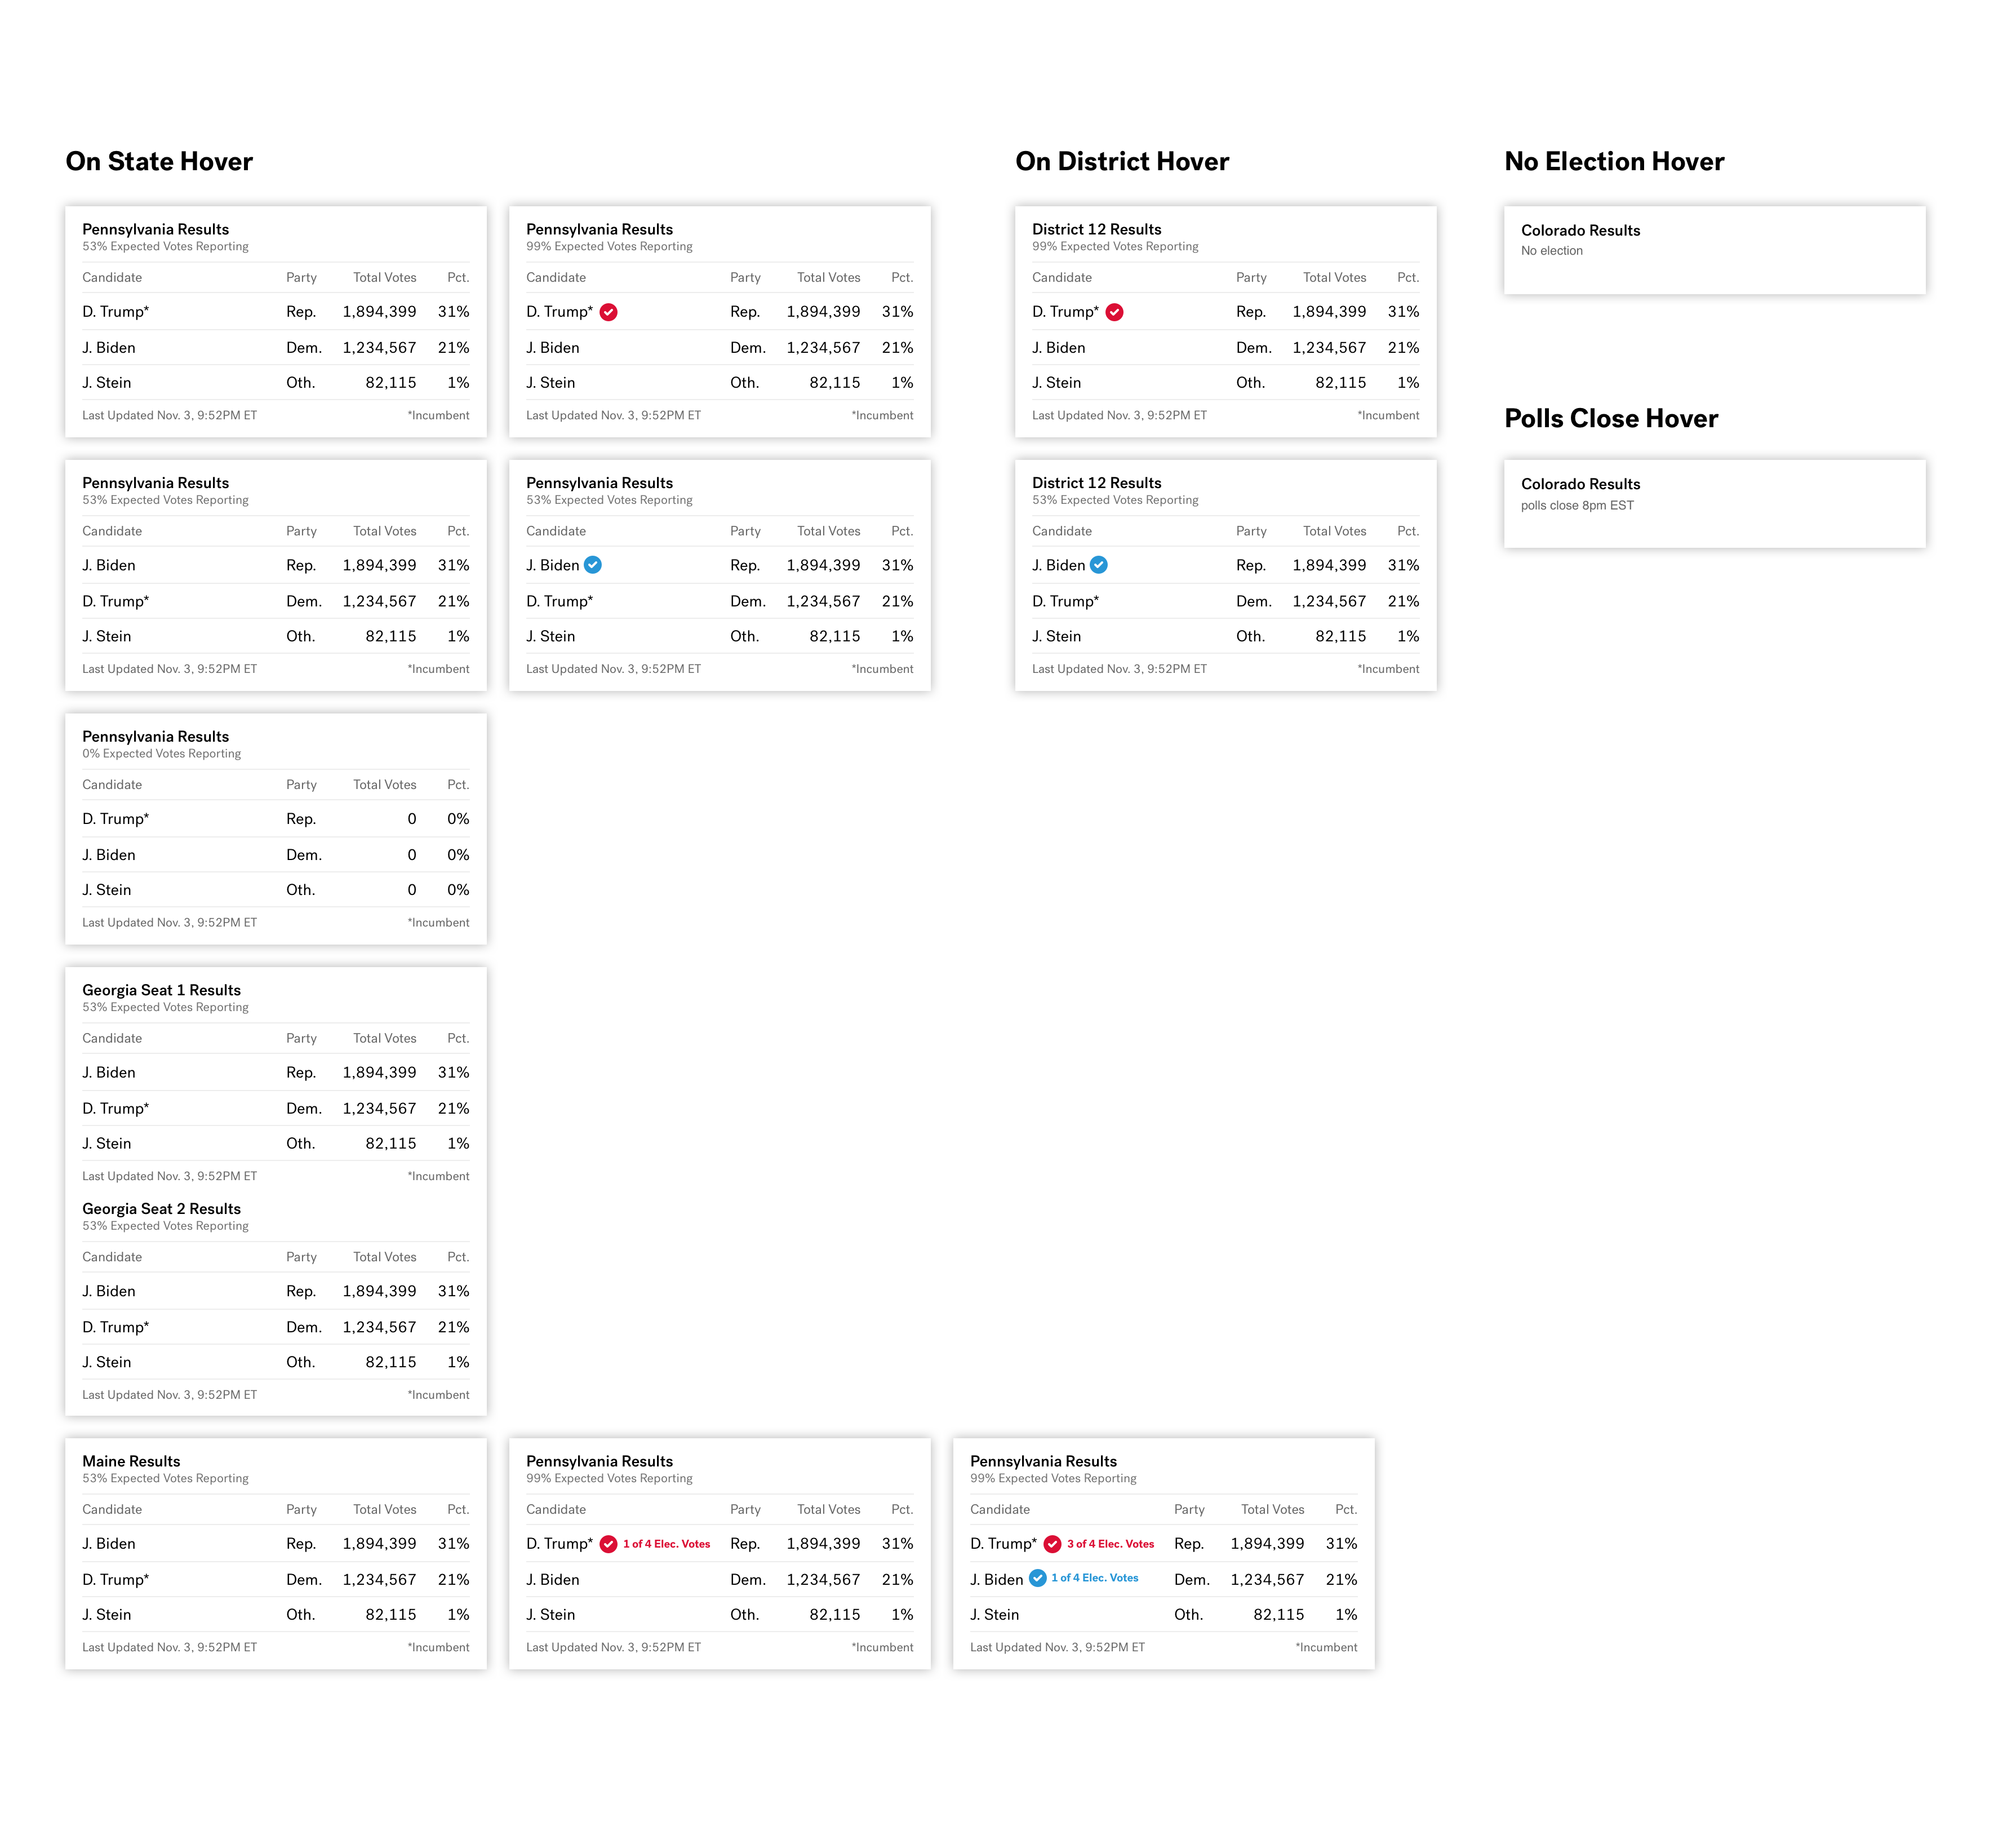
*Disclaimer: The functionality of the live product may no longer be accurate.
OVERVIEW
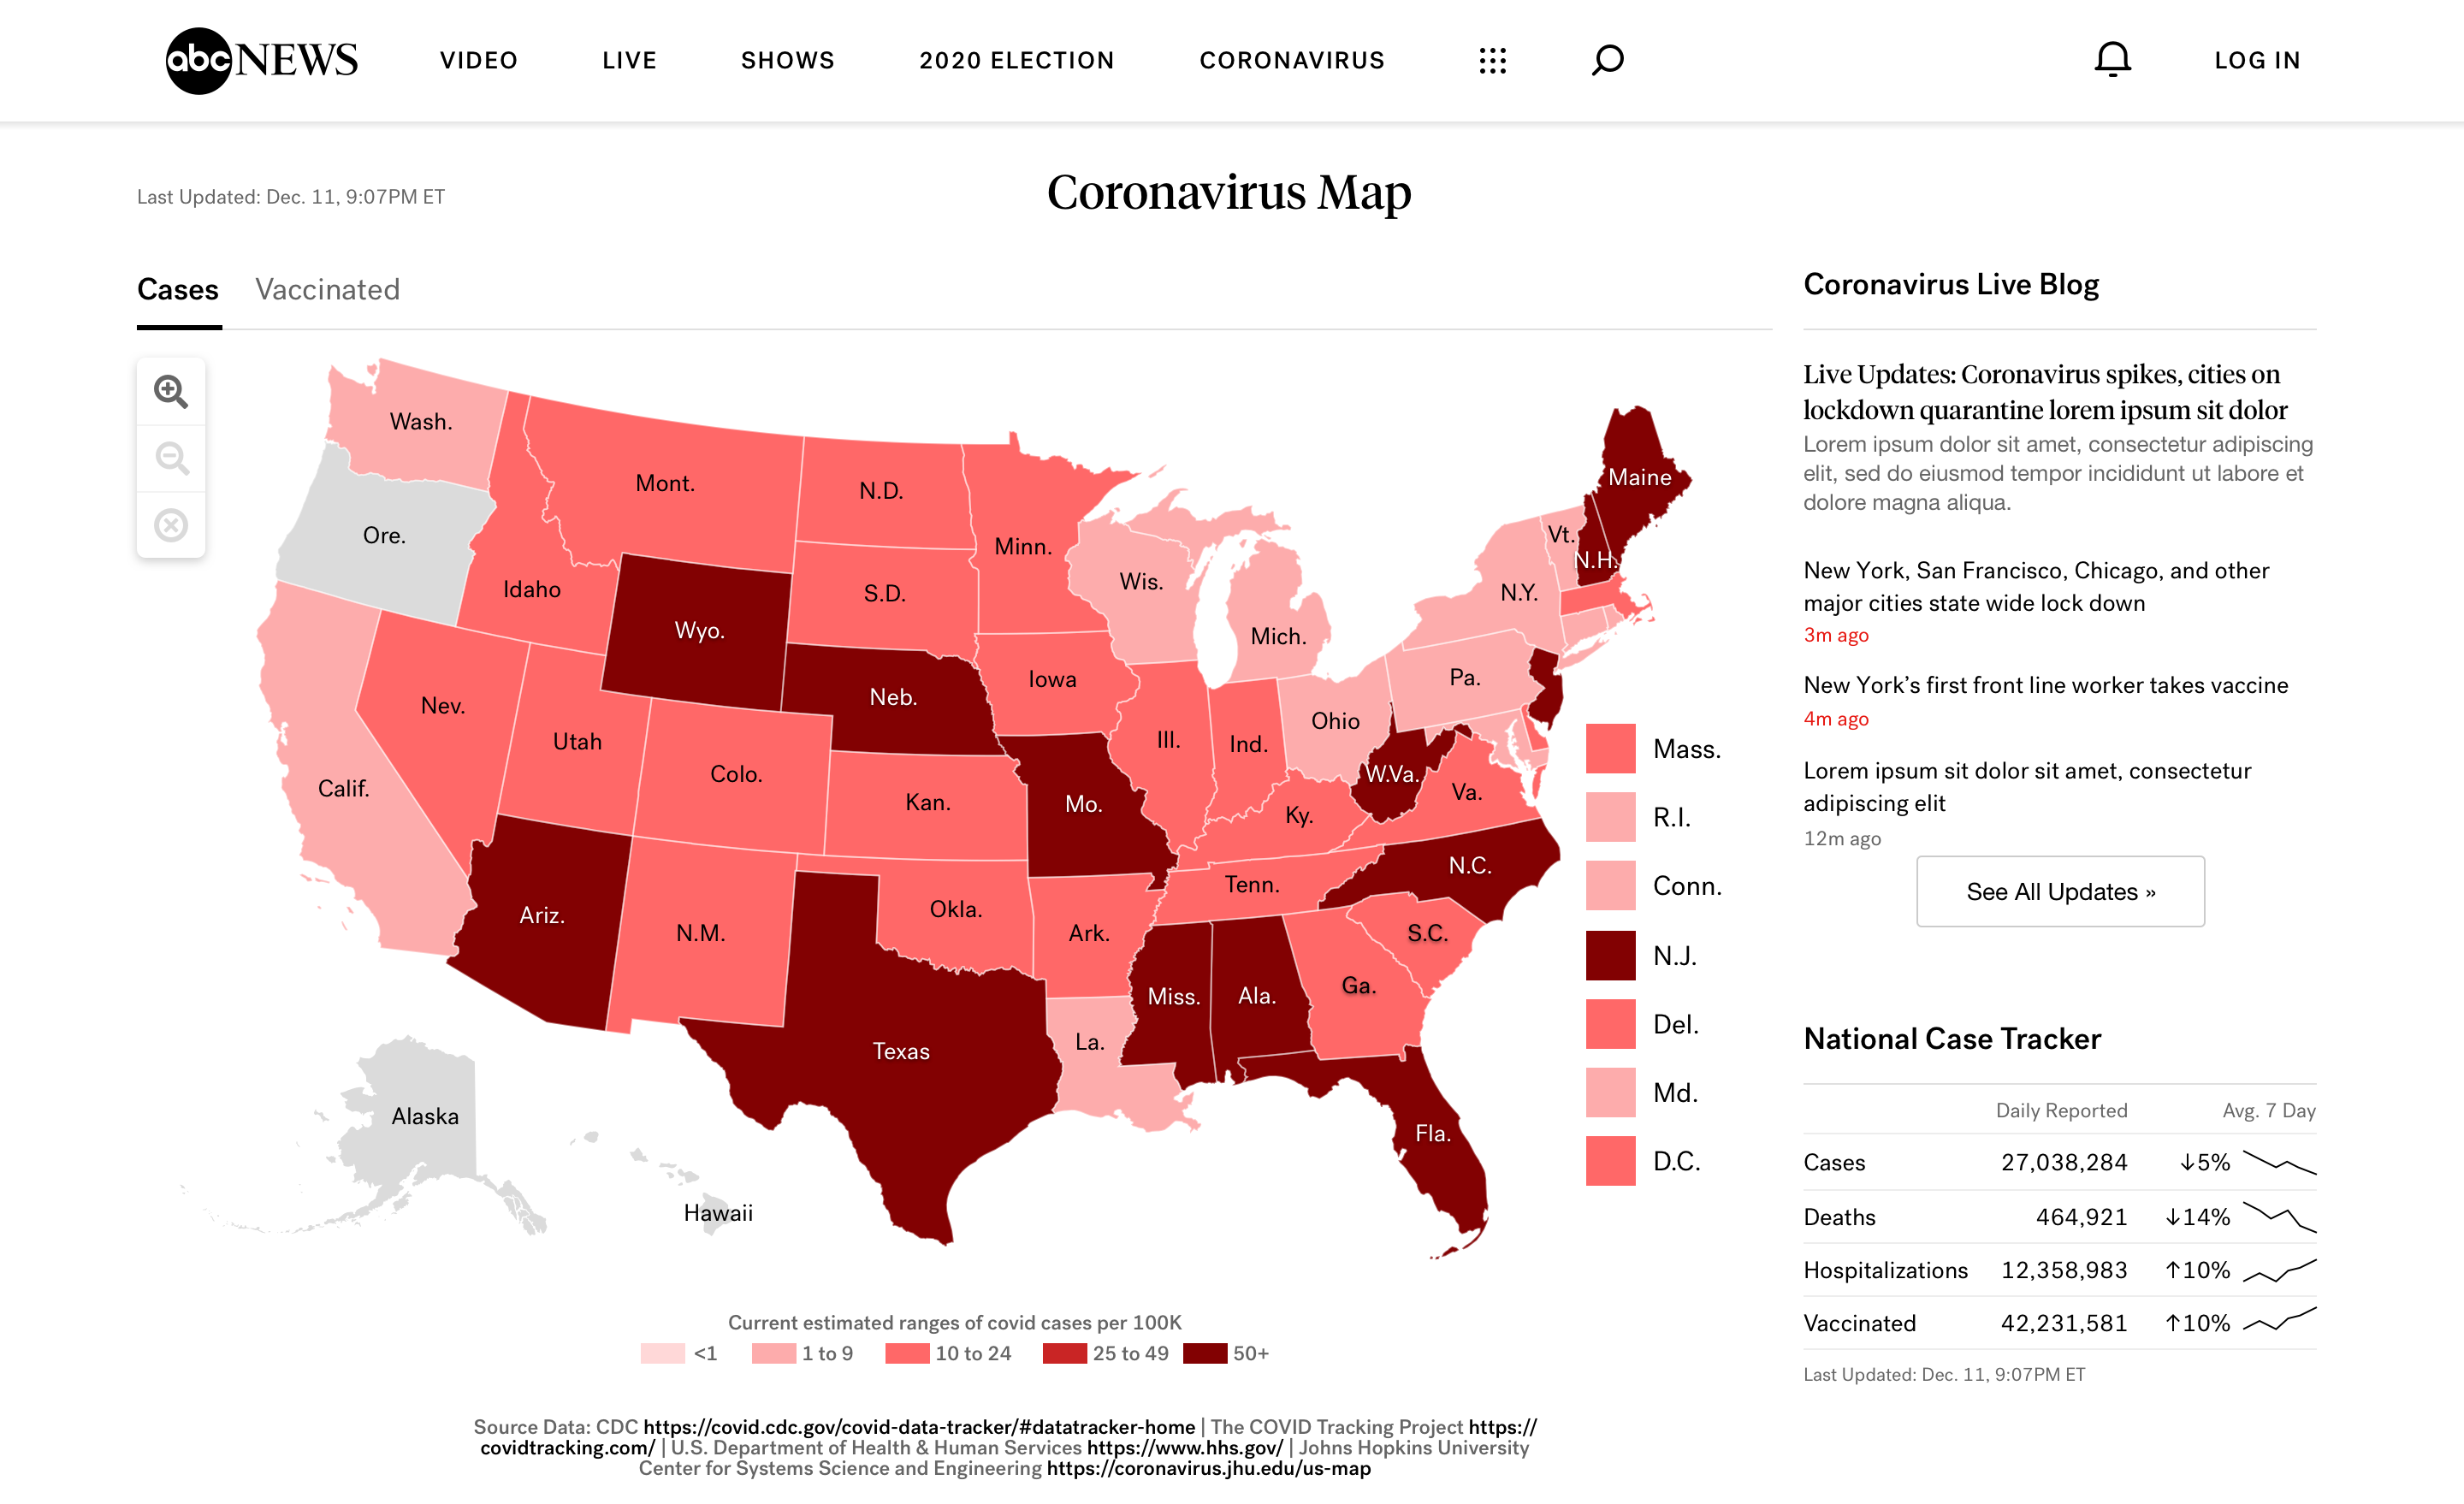
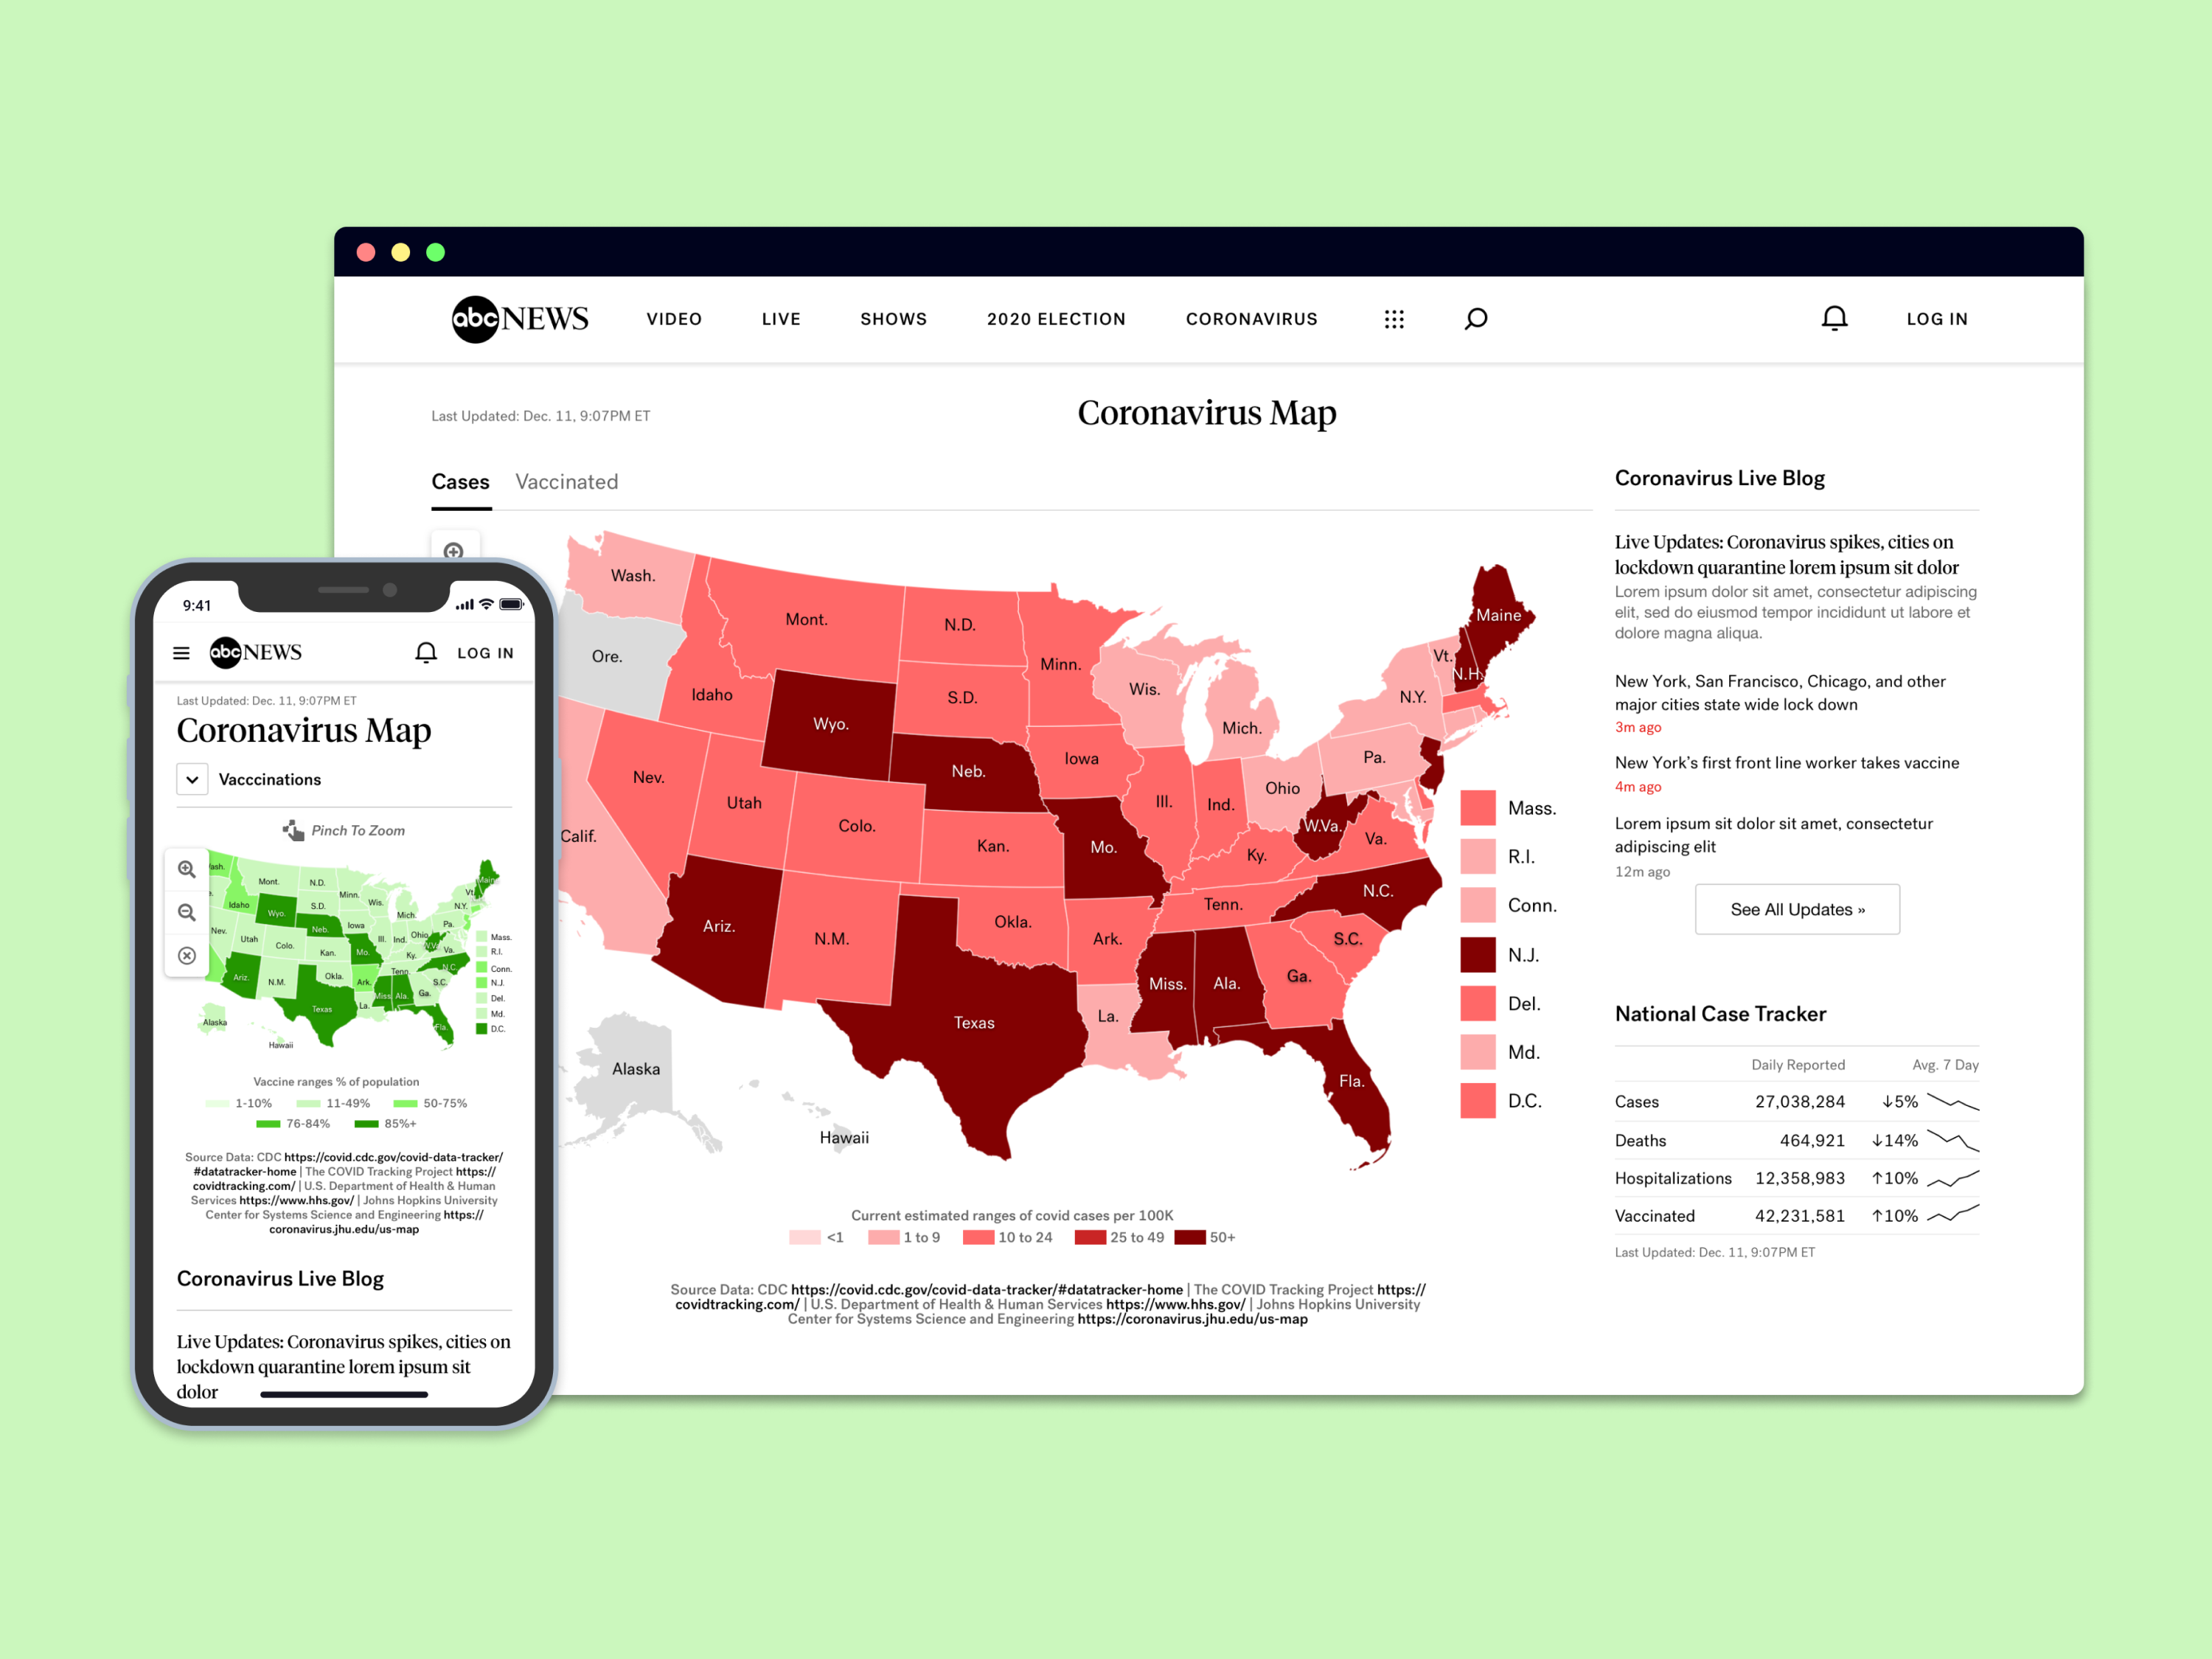
The COVID-19 & Vaccination Case Tracker Map was designed for the sole purpose of monitoring how the country, state, and county are doing in terms of COVID-19 cases and vaccination rates. All data are sourced from CDC and HHS.
Within 2 weeks of launching this product, we have had over 2.6 million unique users that interacted with the tracker.
Team
1 Design Lead (me)
Product
Engineering
Tools
Sketch
Abstract
Duration
3 Months
Jan 2021 — Mar 2021
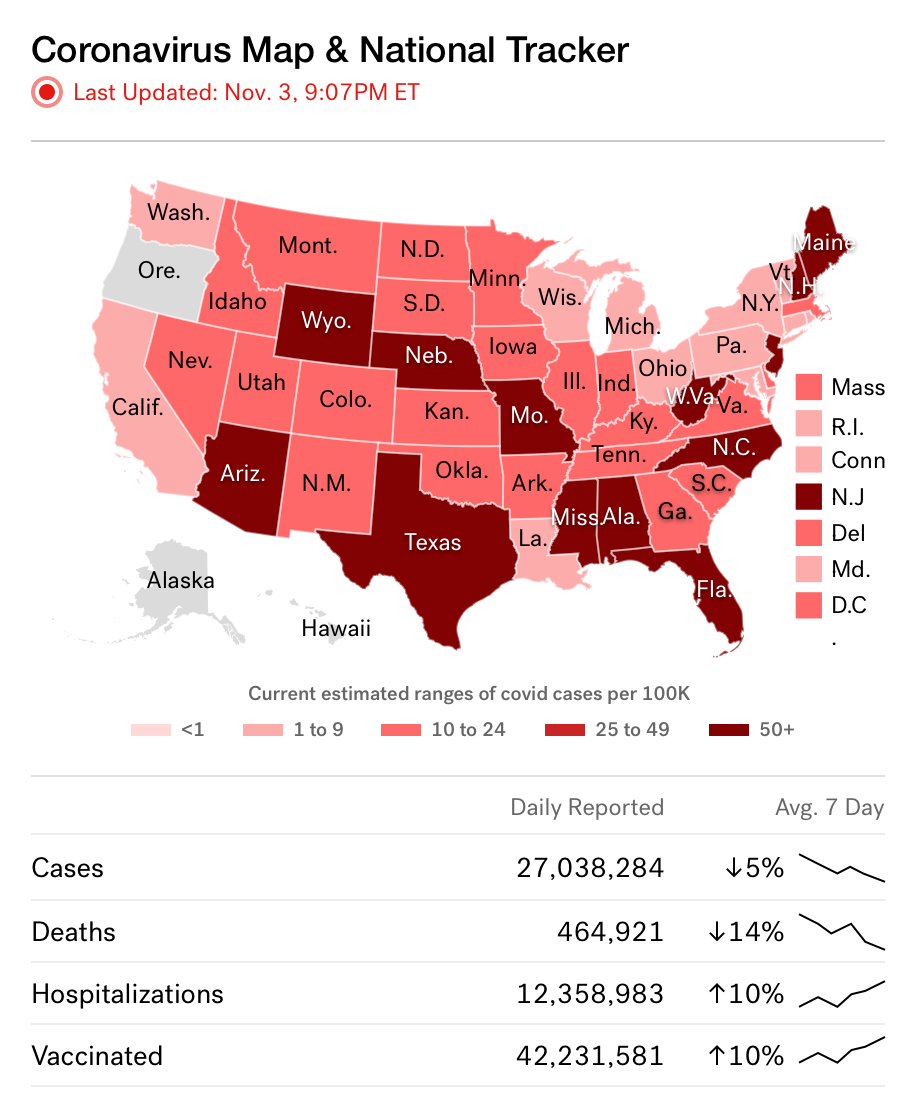
HOMEPAGE MODULE
Taking from our previous experience with the Interactive Election Map, we wanted to provide users an easy way to keep track and understand what's happening throughout the country.
By implementing a case tracker below the map, users are able to grasp important data right away.
These data points show the total reported cases, deaths, hospitalizations, and fully vaccinated.
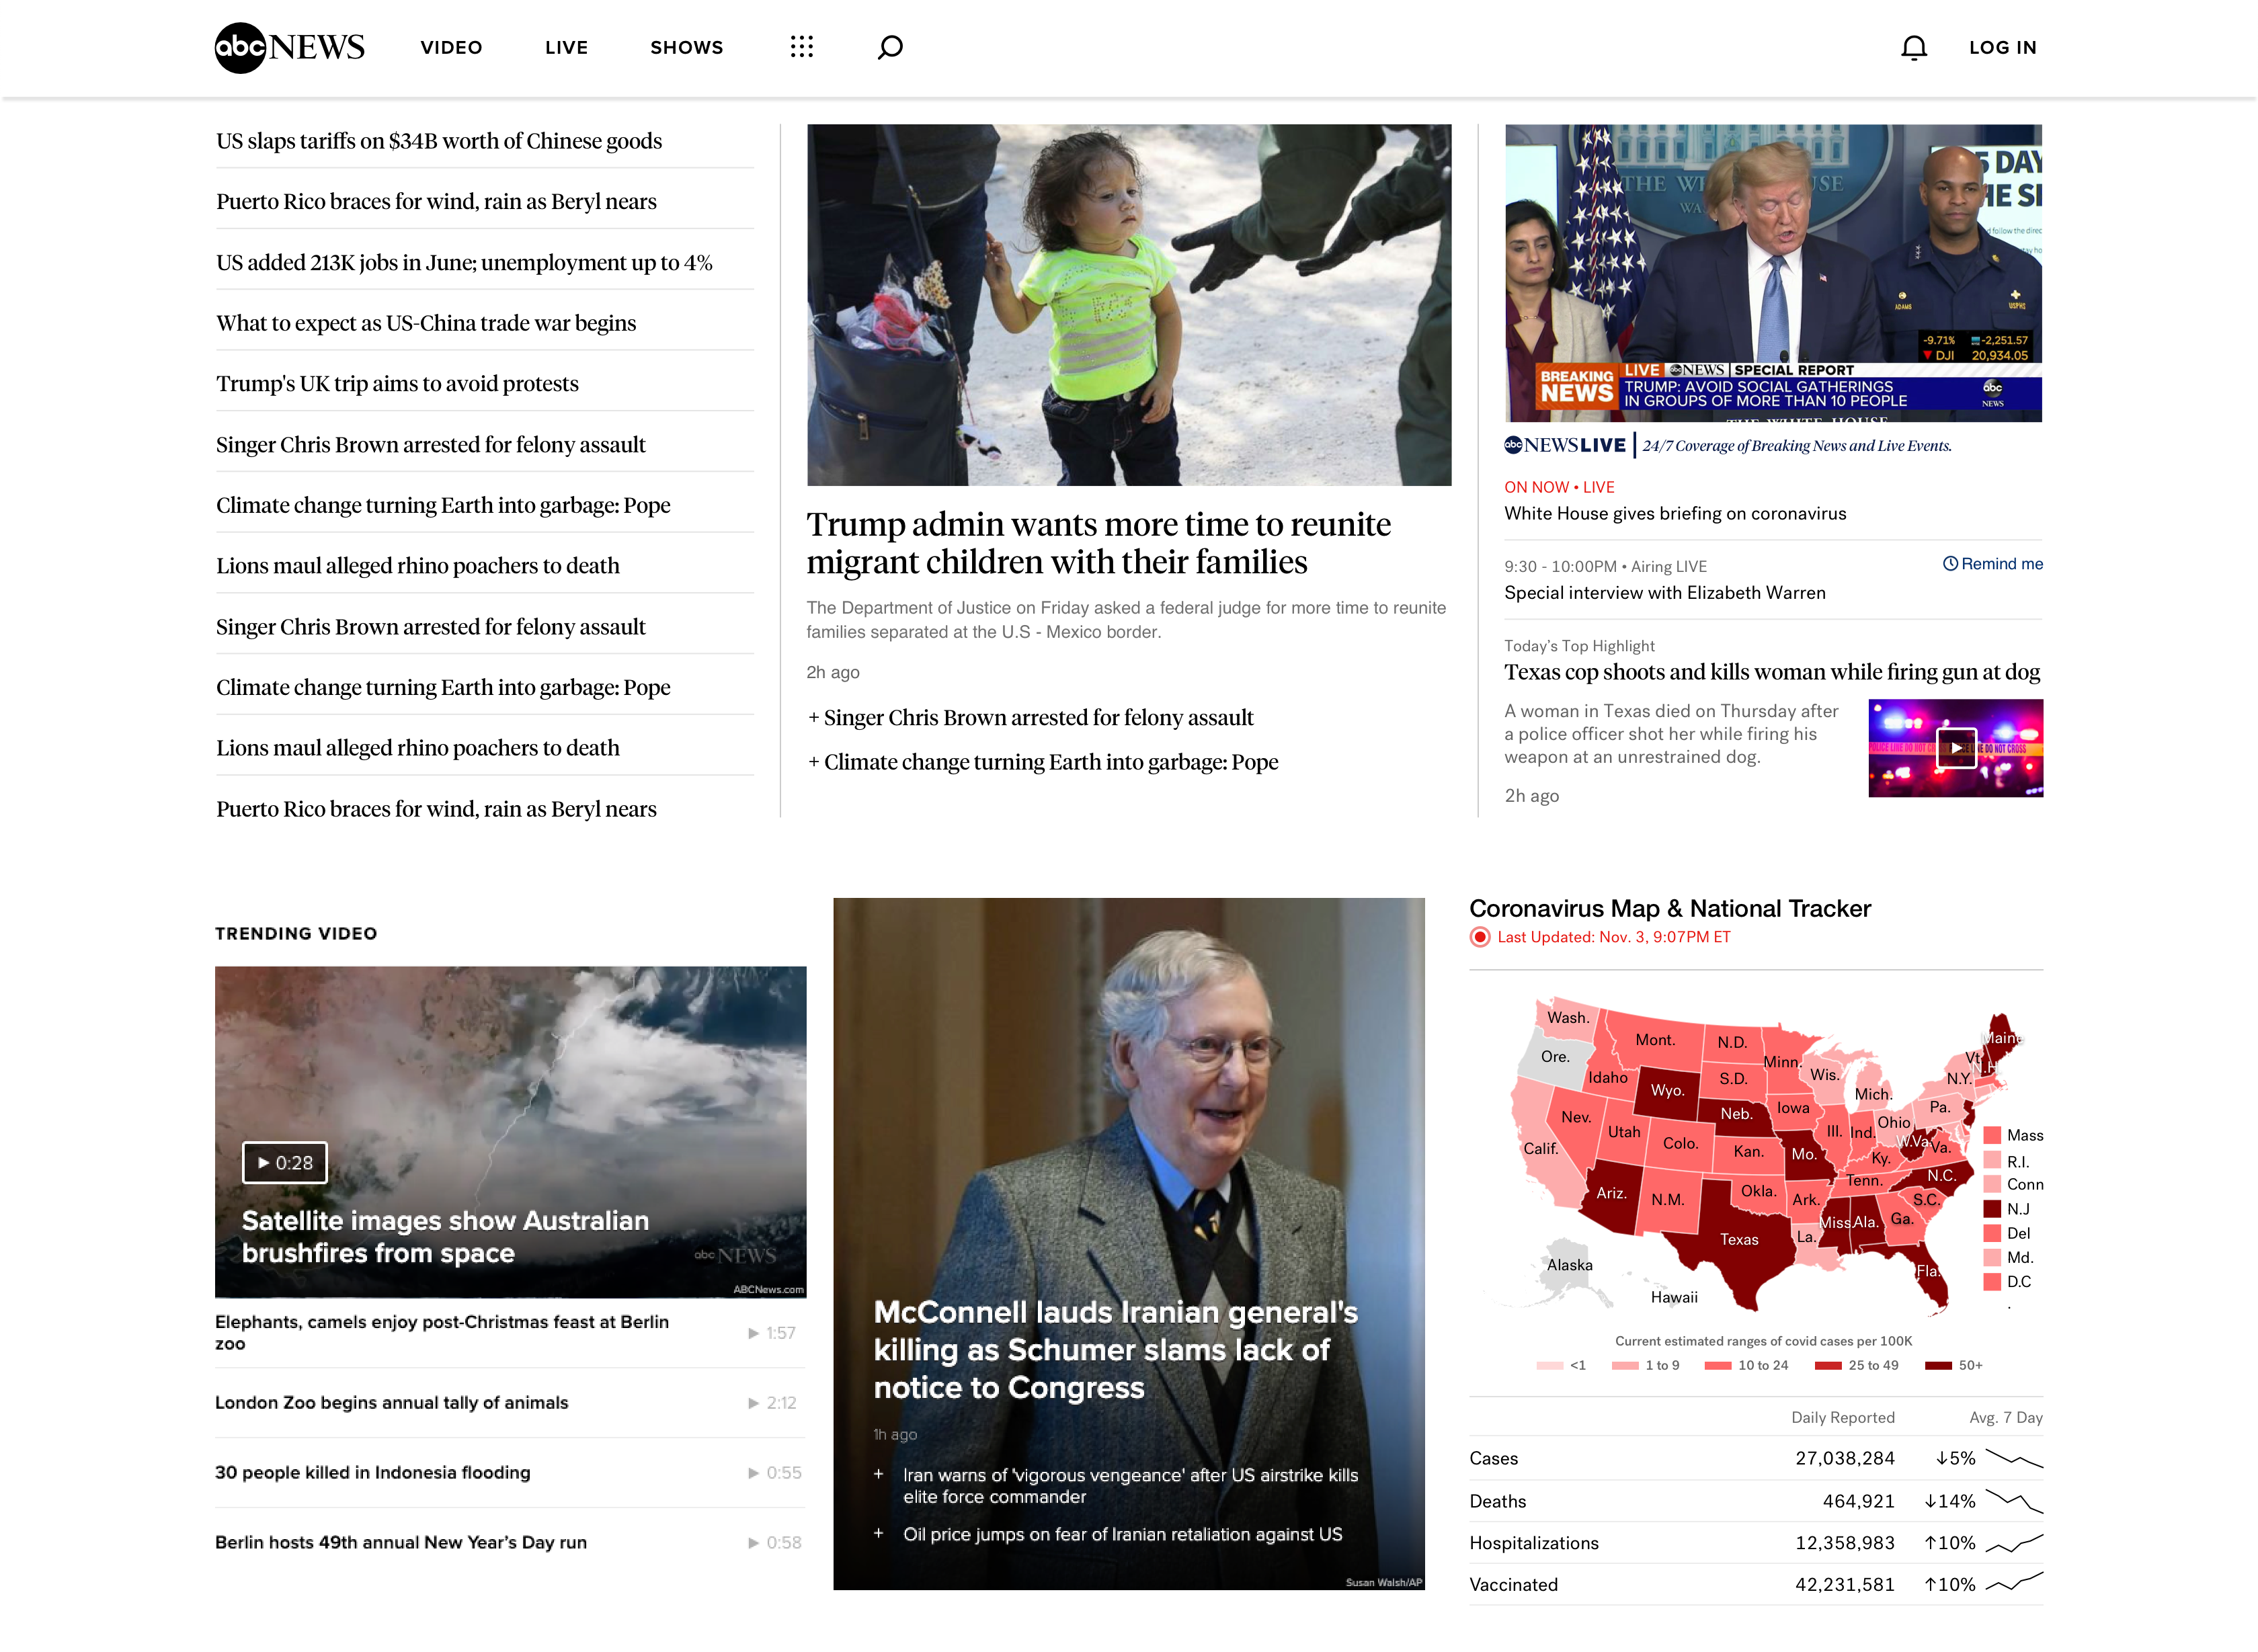
CASE TRACKER UI
The original design of the case tracker on the homepage was just the map with the CTA to see the full experience. I felt that the user experience behind this was a little bit unnecessary. Users shouldn't have to go to another part of the site to see information about the cases. Users should be able to get a quick glance at the data while browsing through the homepage.
So to improve the user experience, during our discussion with Product, I suggested this design feature to include quick data of the cases for users to see at a glance. The idea was well received and I got started with exploring different designs.
An example of one of the designs was having the data be large and informational. Visually it is pleasing to the eyes but we found that displaying the information in a larger context takes away the cohesion of the map and the case tracker data. The module would have to be split into two which wasn't what we were aiming for.
Another design feature I suggested to be implemented was to add percentages and a visual graph of the average of the past 7 days. By doing so, users are able to see the trend within the week and understand whether these reported data are going up or going down as a whole.
Below is the design we decided to go with. On the desktop, the case tracker will display the percentage and the trend line graph. On mobile, we drop the trend line graph and only display the percentage due to screen real-estate.
Final Module Design
This is an example of what the COVID-19 national case tracker module would look like on the home page of ABCNews.com. Users are able to quickly glance at the info without disrupting their browsing of other news.
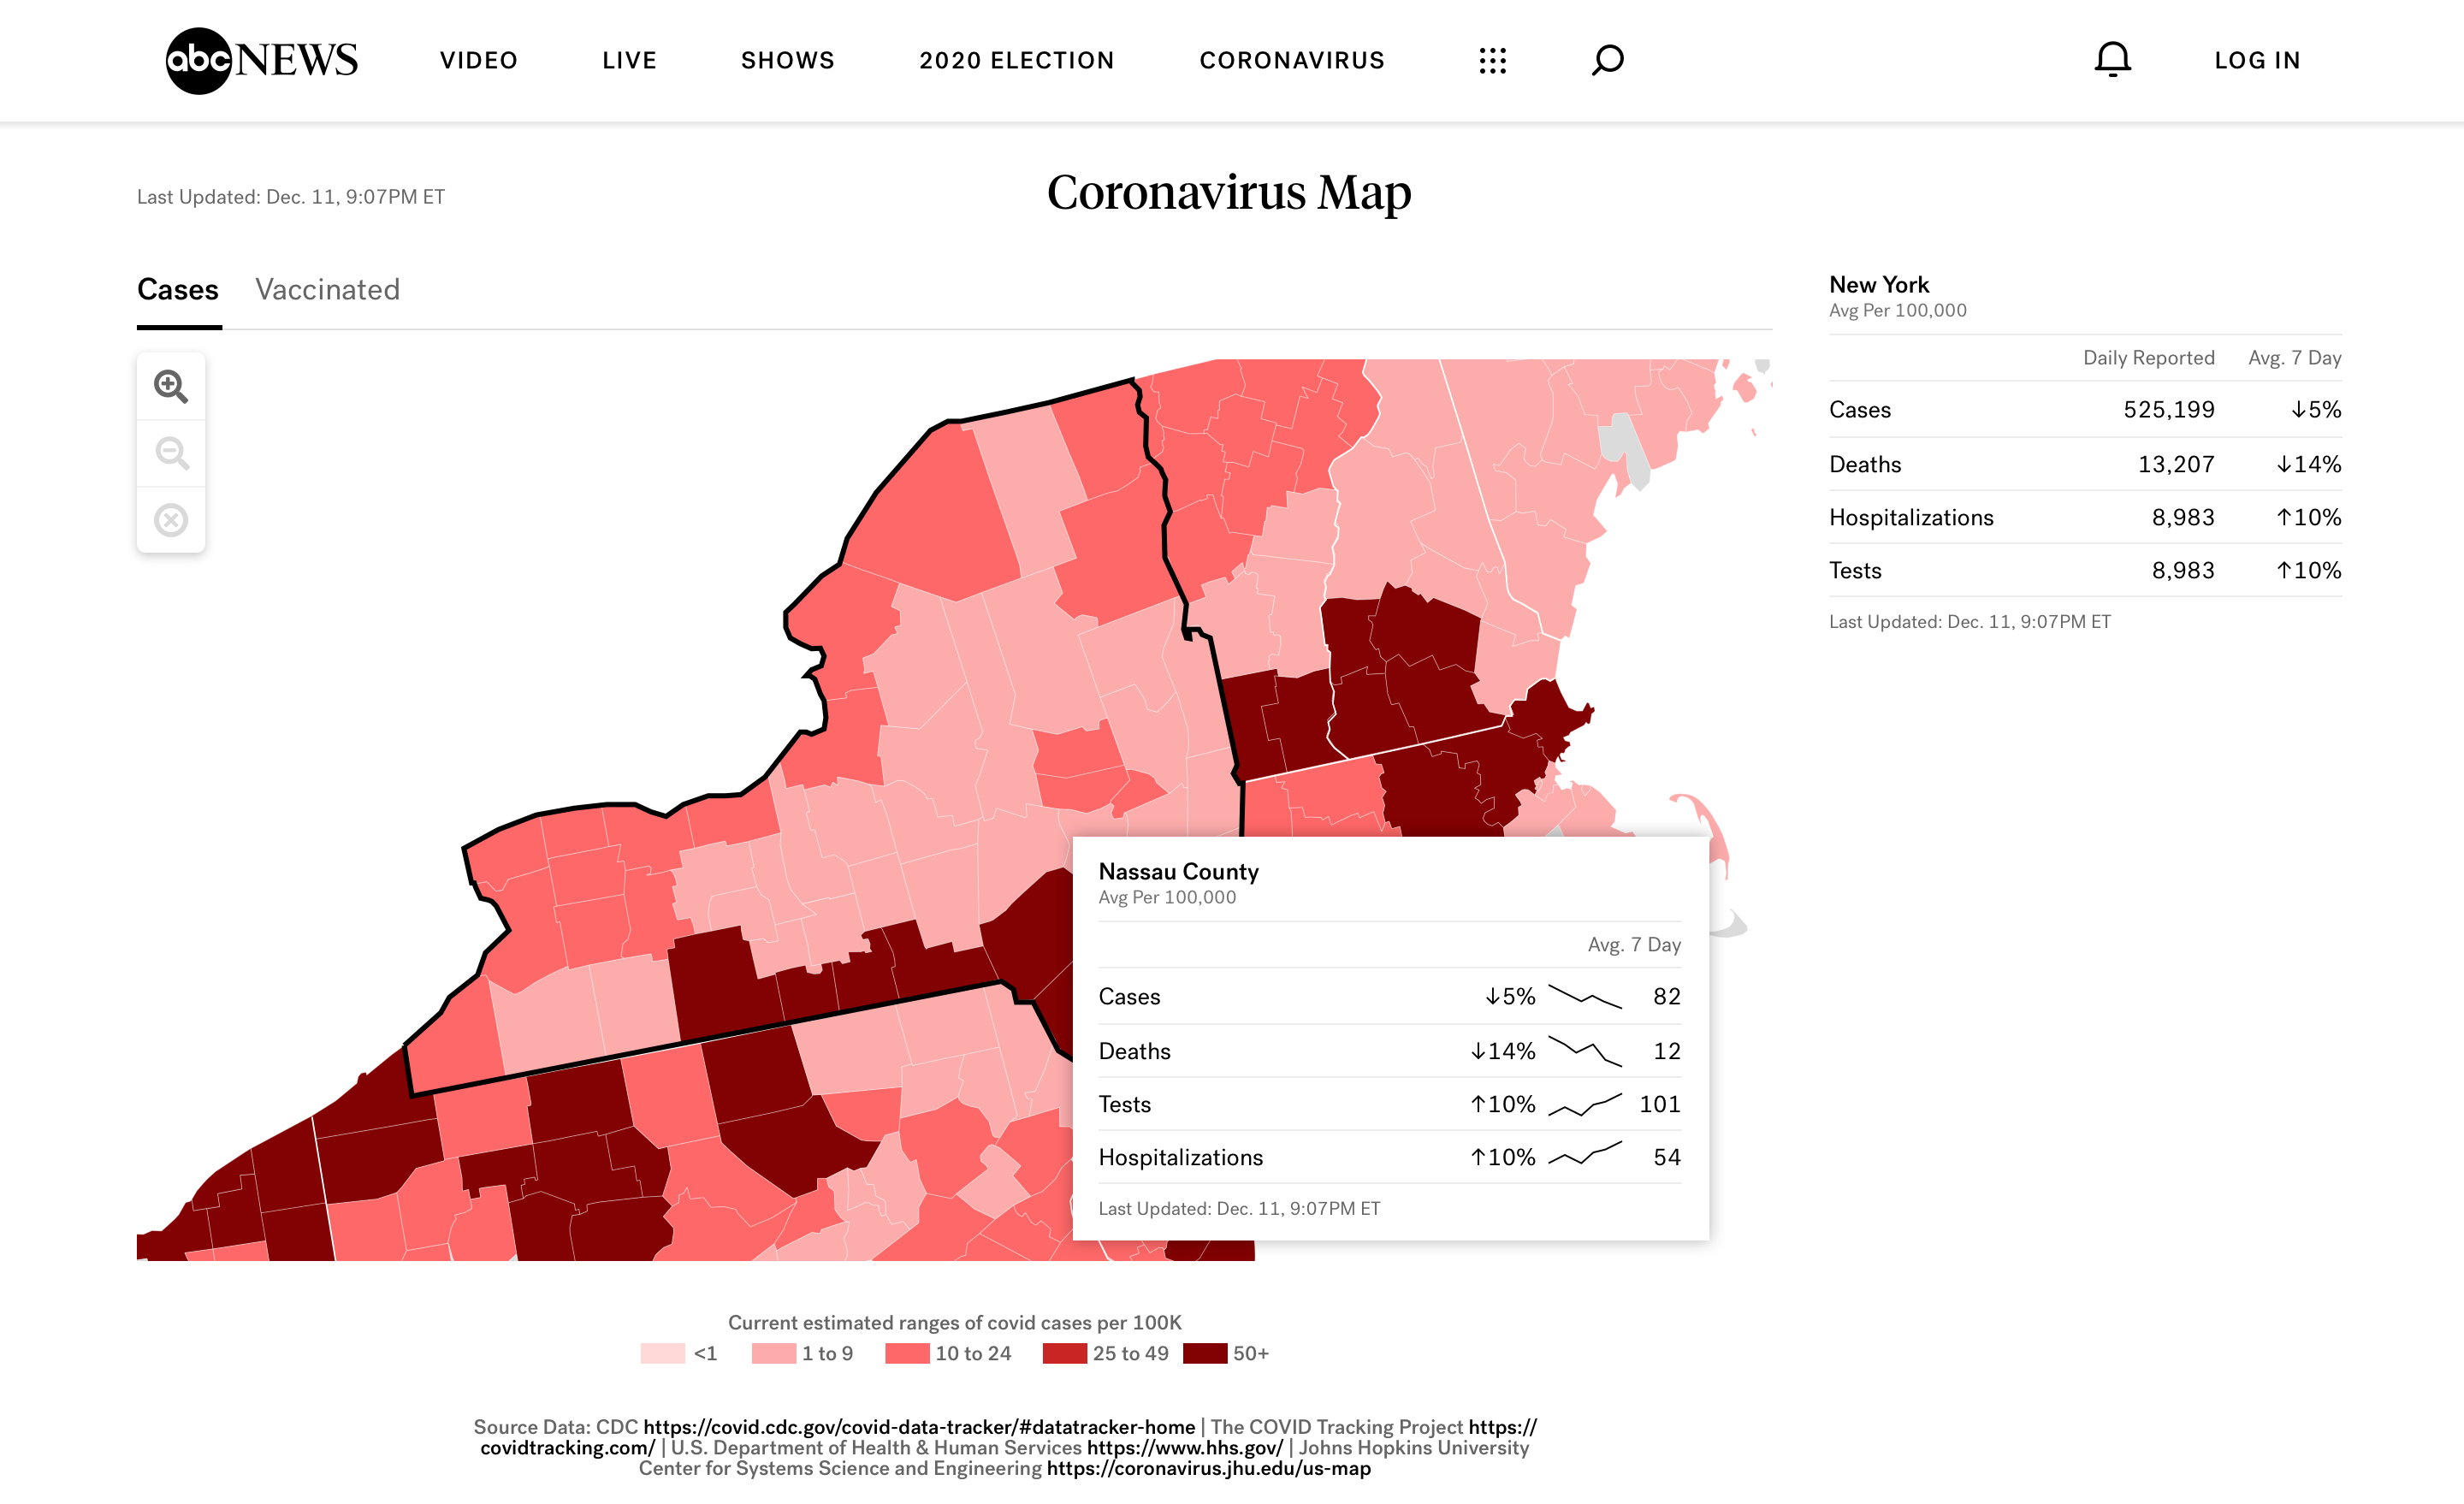
HOVER CARD UI
For the Election 2020 map, we designed a series of hovercards to feature important information quickly to users just by hovering over states and counties. We took the same feature and implemented it to this map. By doing so, users are able to identify what each state or county is going through and what to be aware of.
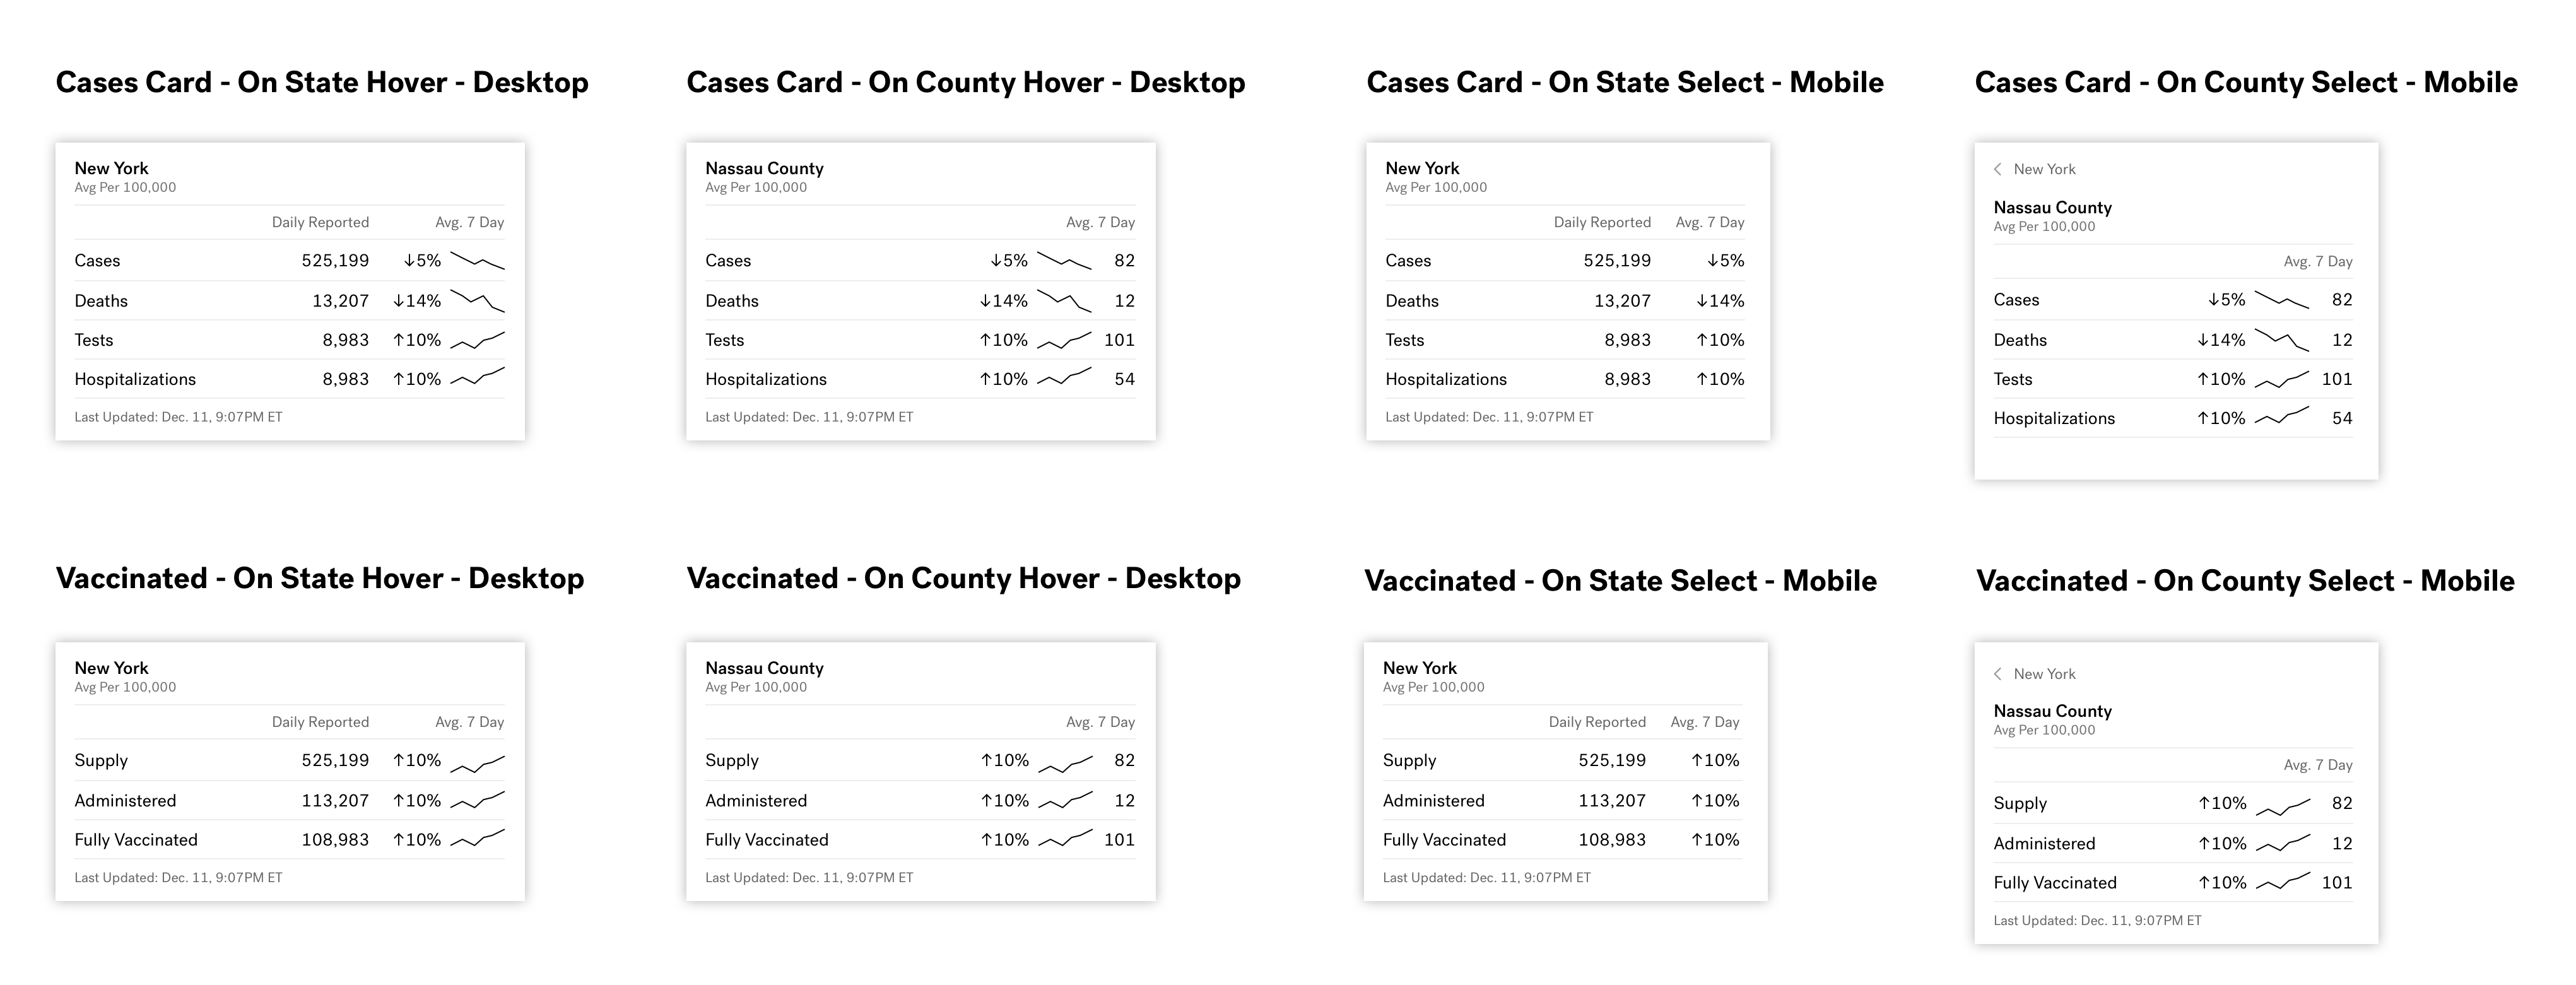
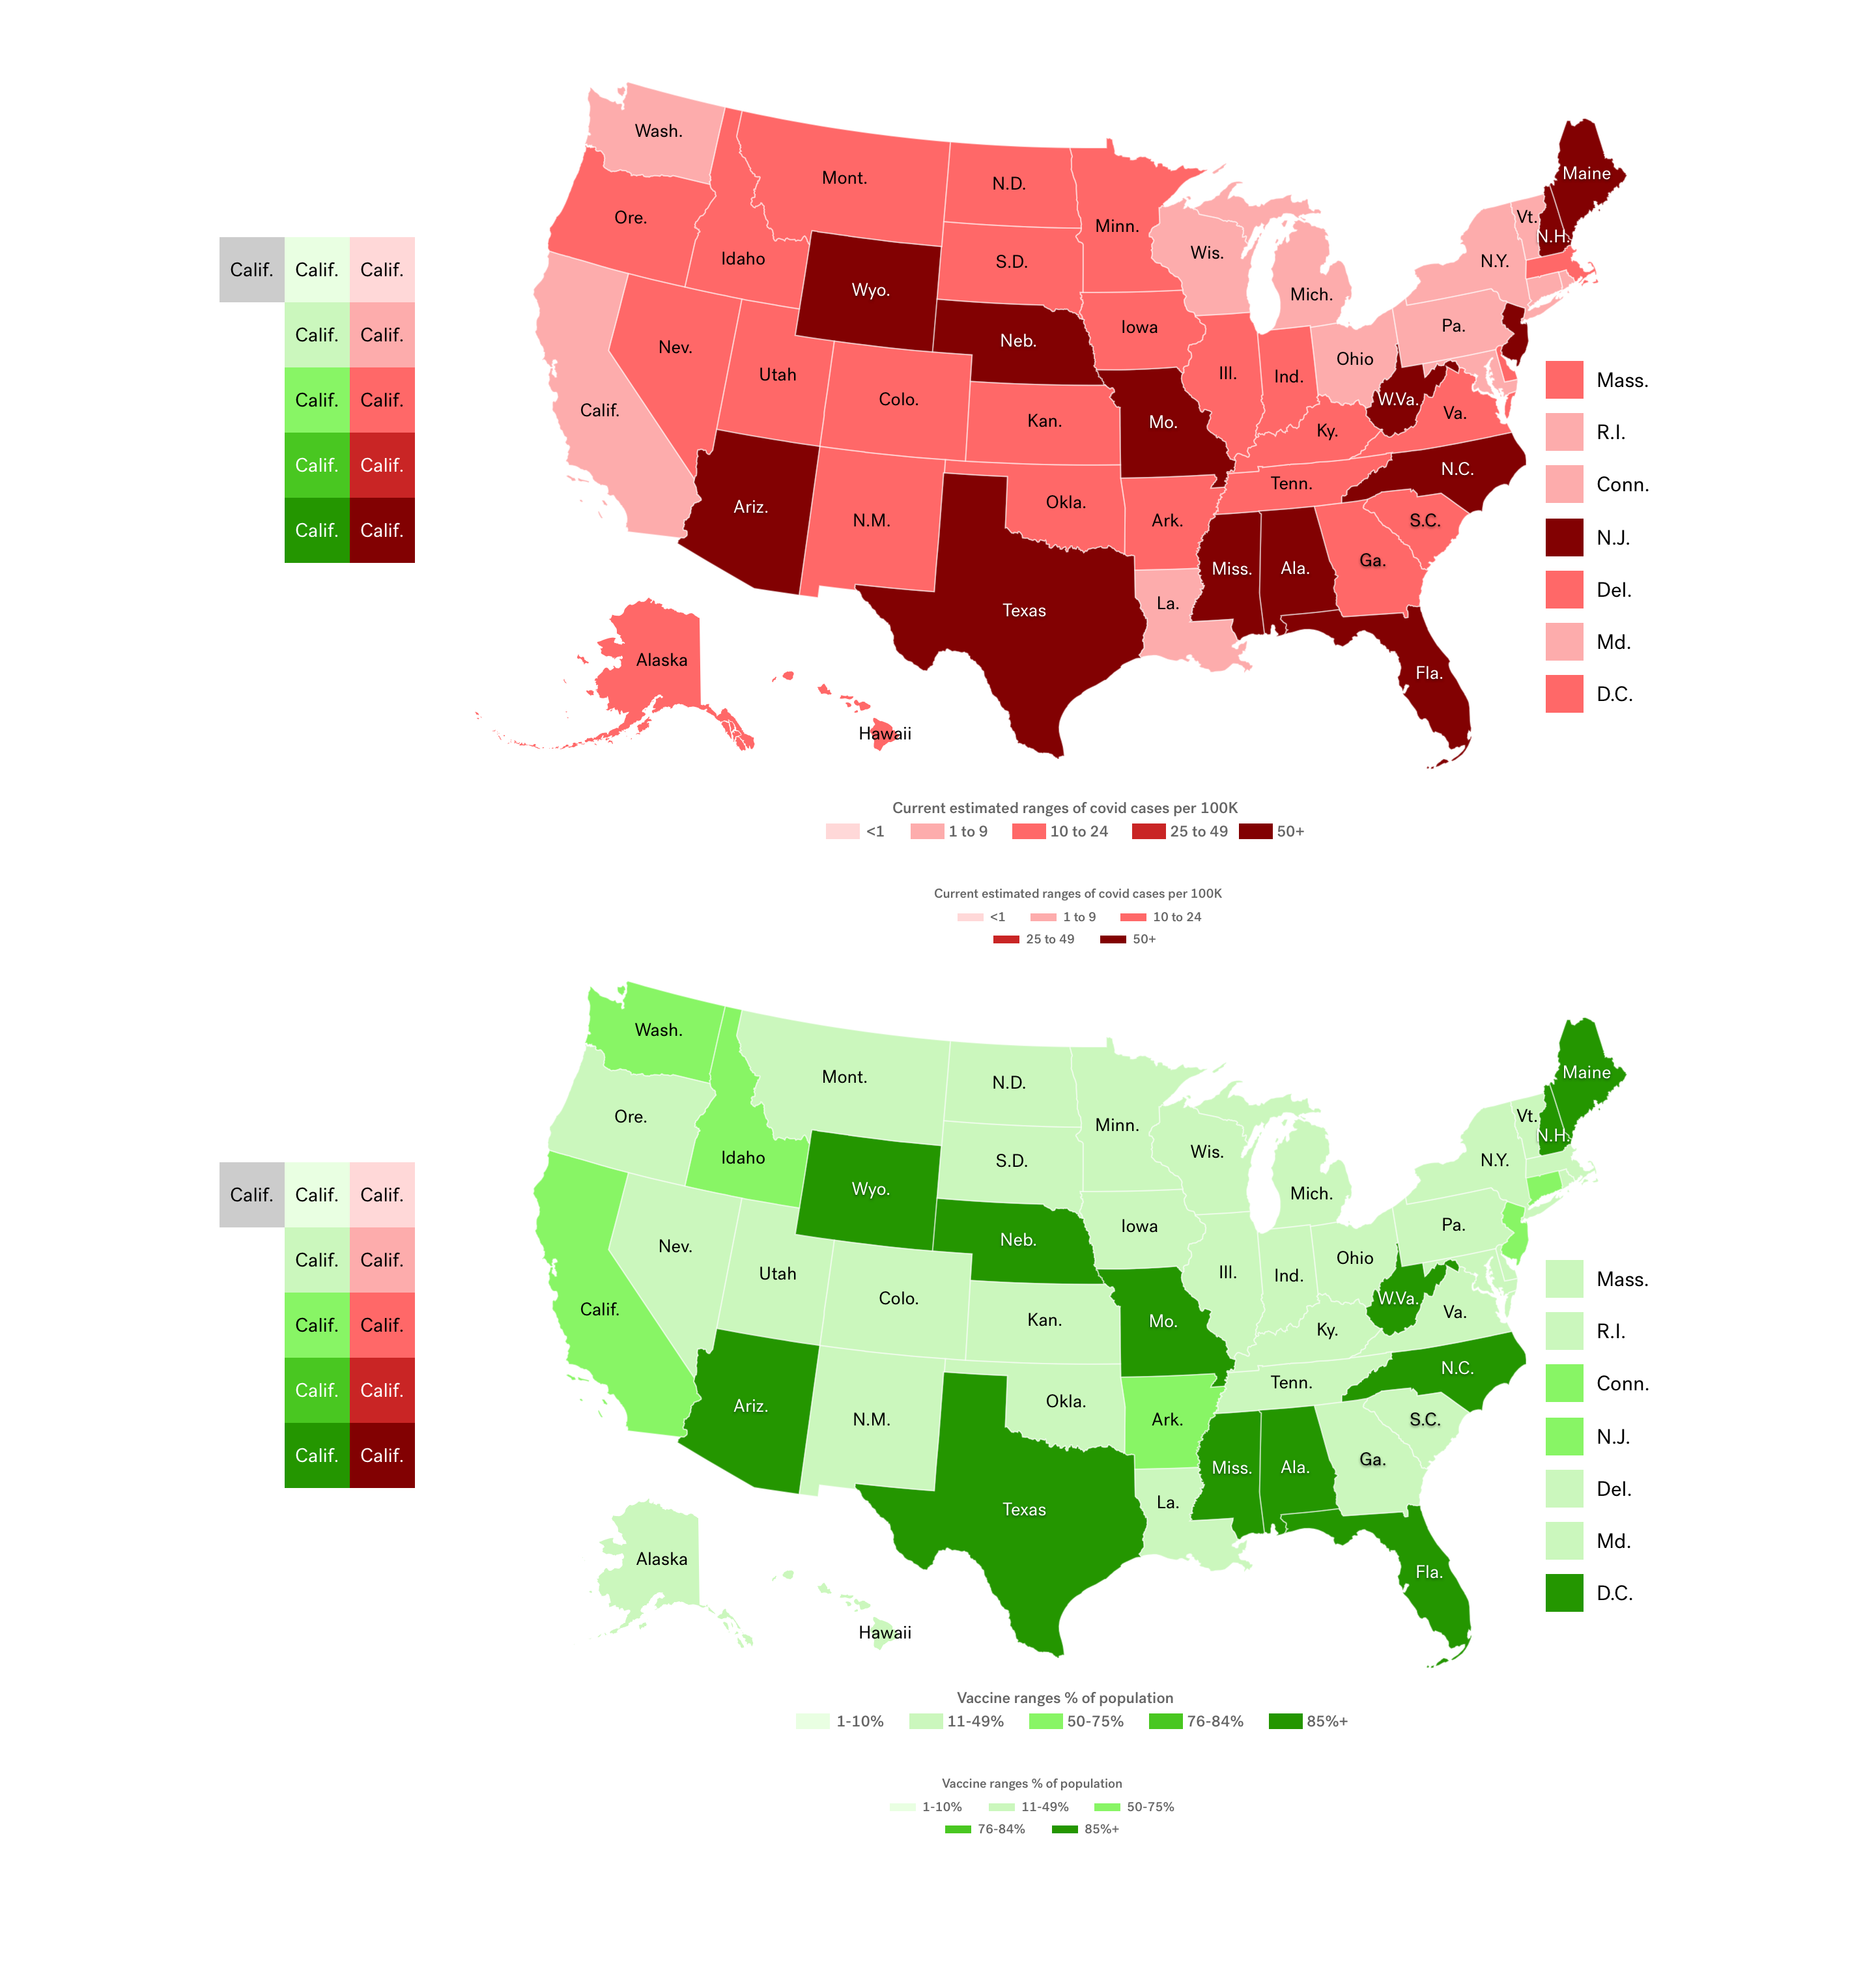
COLOR DIFFERENTIATION
For visualization purposes, we differentiated two sets of colors for the COVID-19 and vaccinations cases. Users are able to view these data with dynamic map shading.
We tested a series of red palettes to represent the cases of COVID-19. Red was chosen due to the urgency and alertness of the color. We wanted users to know what the situation is within different parts of the country or even specifically their own.
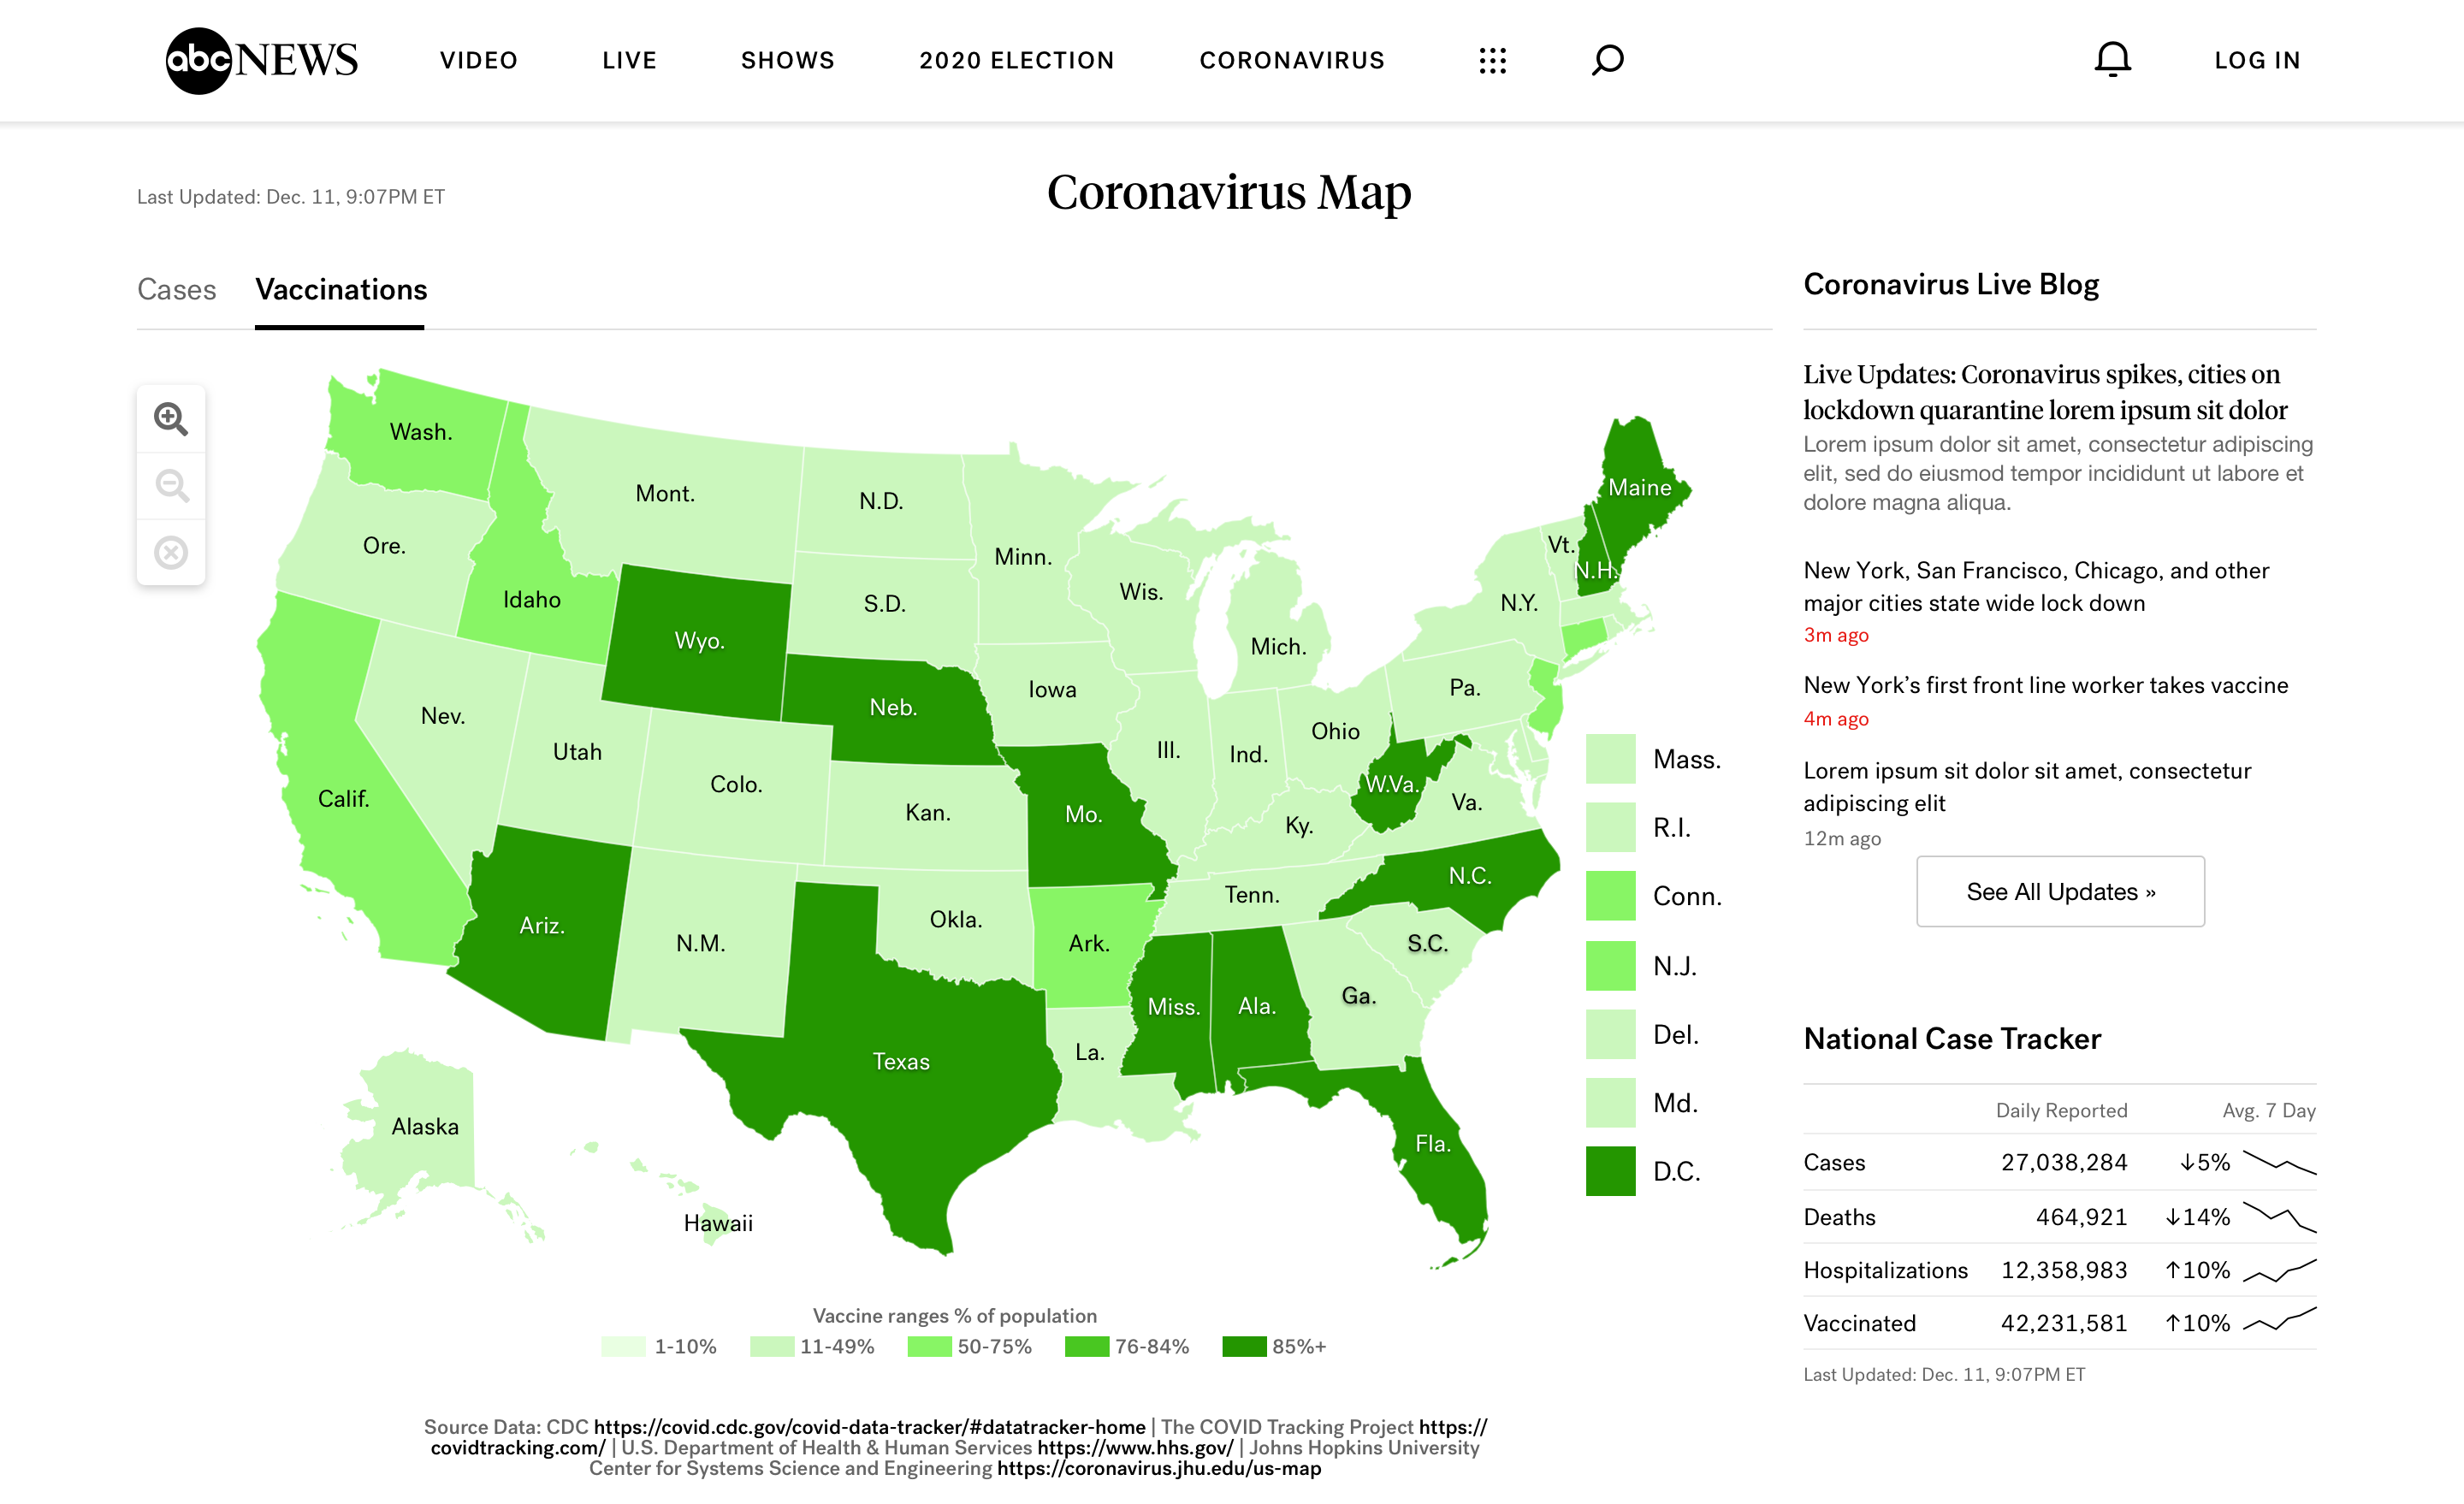
We also tested a series of different colors to represent vaccinations. We tested variations of orange, purple, and green. We decided on the latter due to the color providing a feeling of recovery, healing, and more positive nature.
USER INTERACTION
The COVID-19 and vaccination maps have similar interactions to the election map. By doing so we kept consistent within this map feature and engineering was able to reduce the time needed to launch the product.
Users can view the national map along with other features like the Live Blog (which keeps users updated on the latest news related to the topic), and the National Case Tracker.
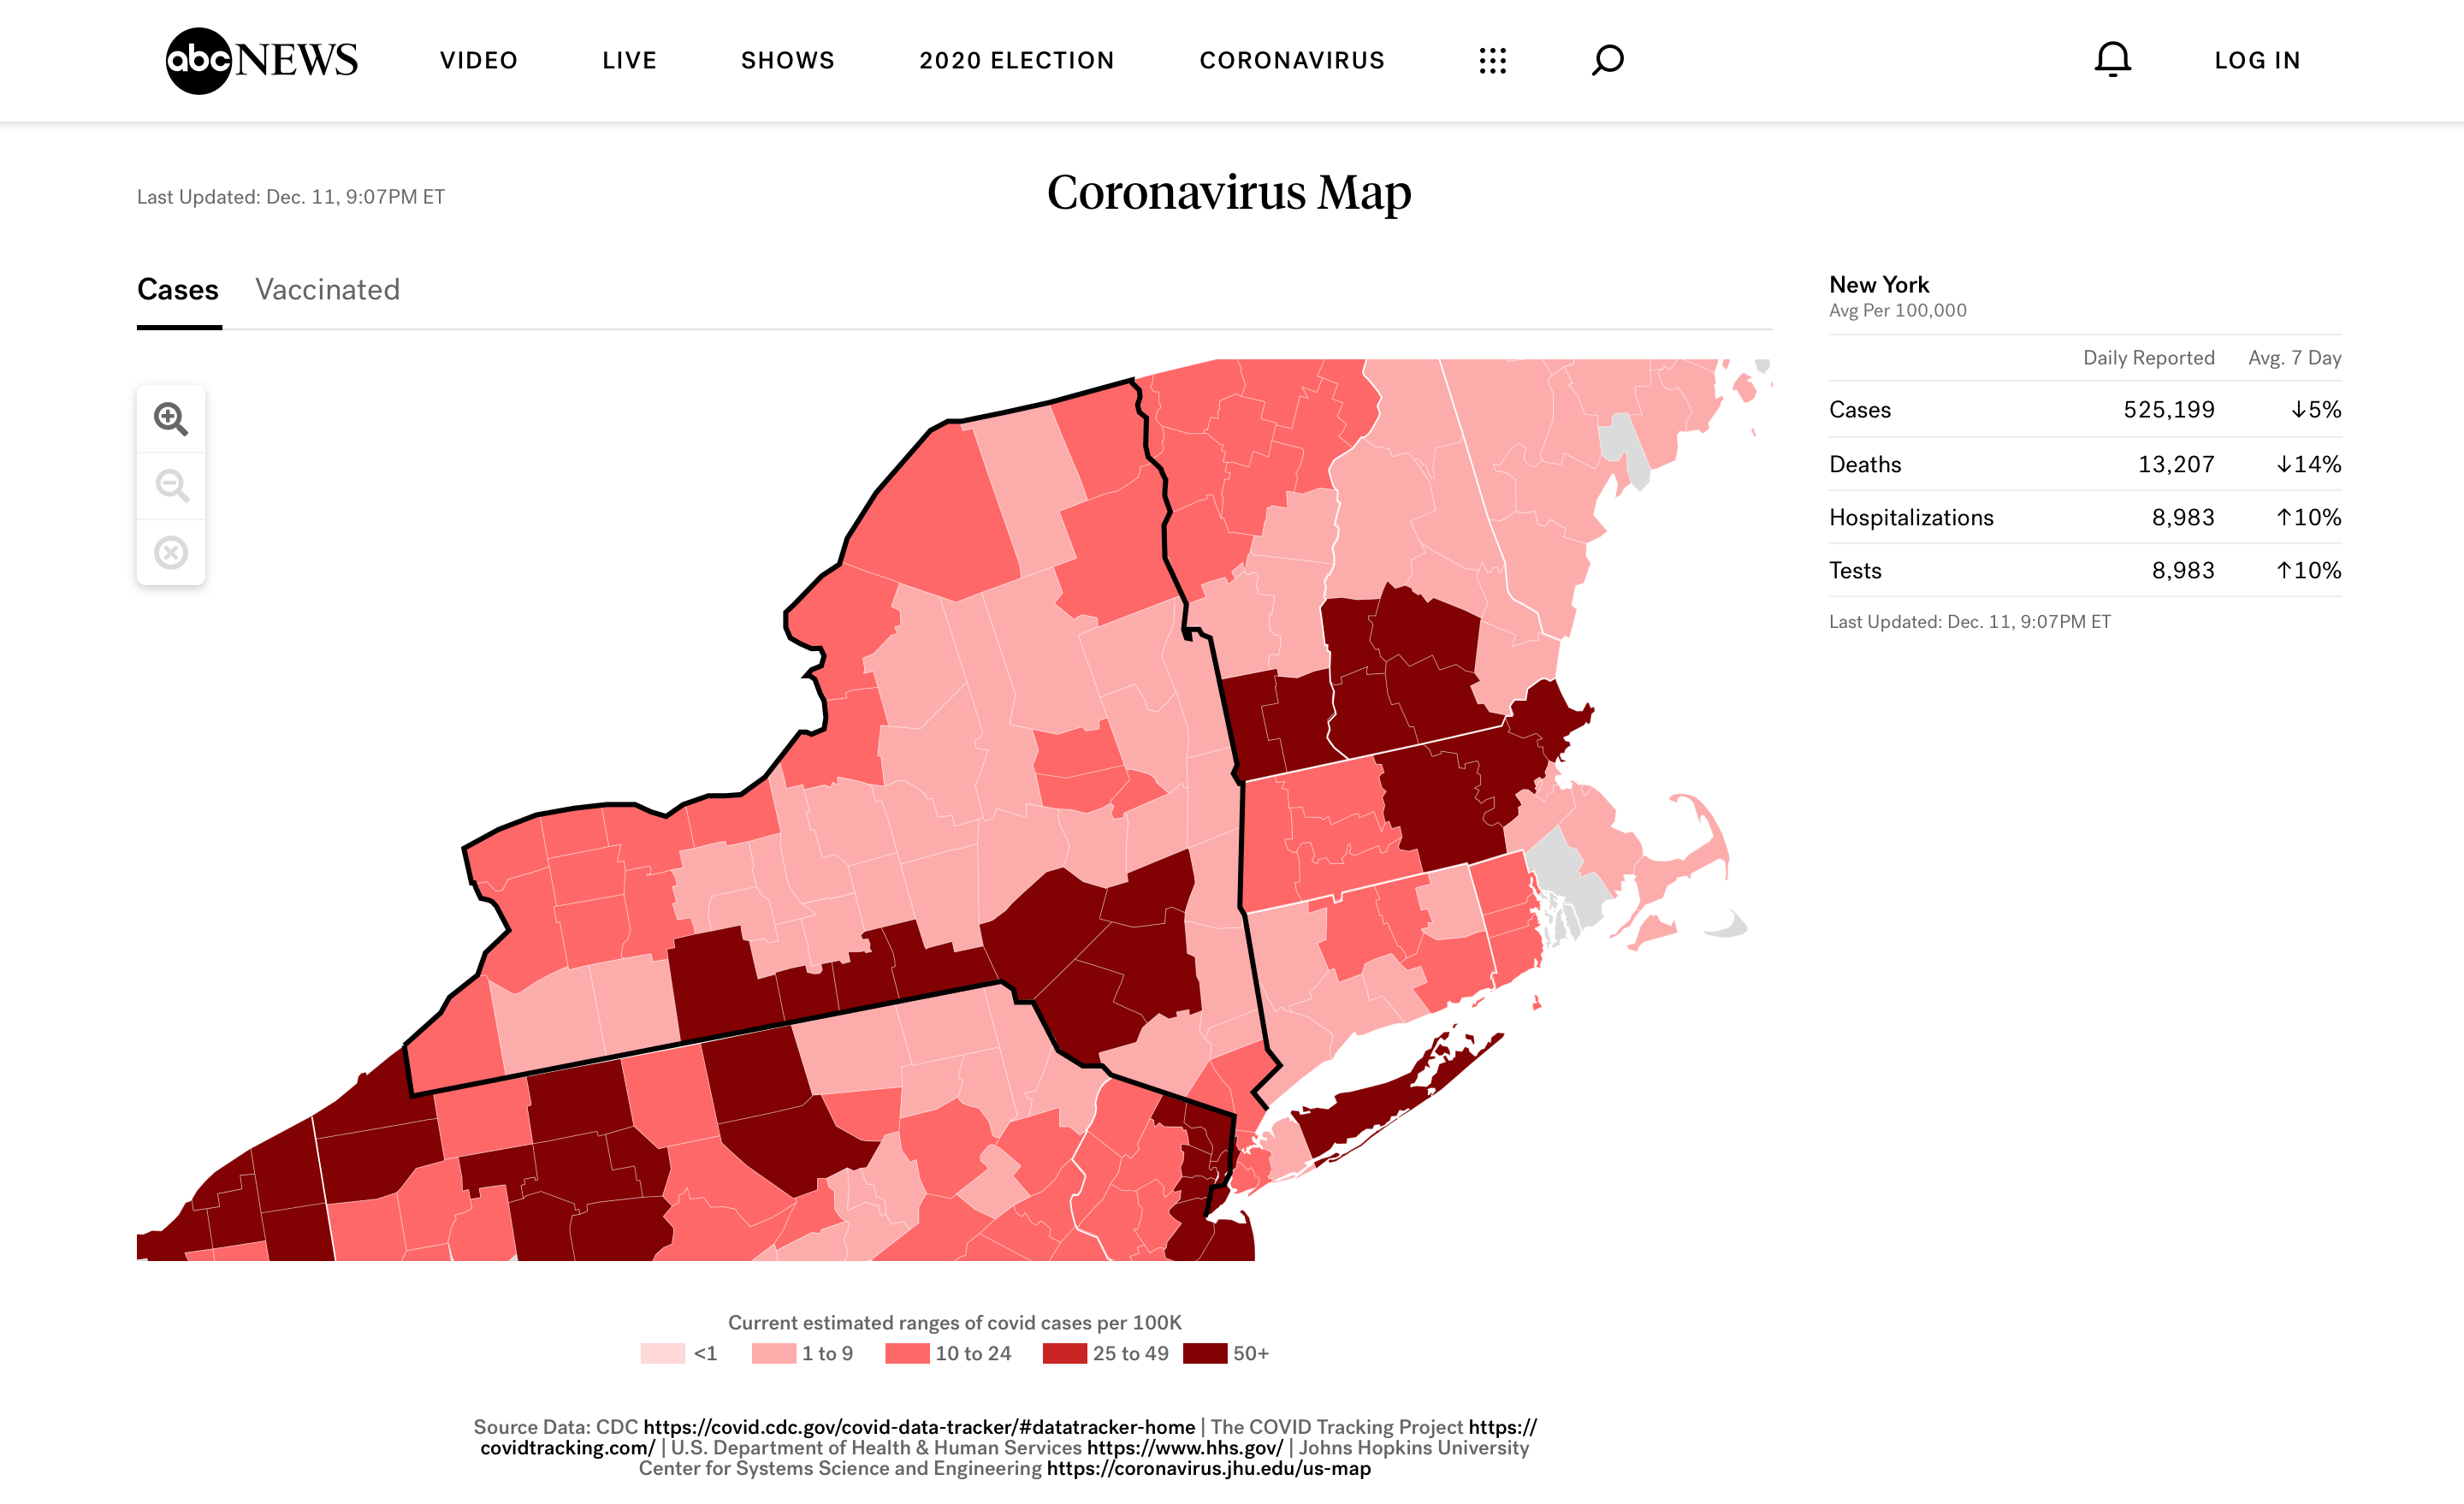
While hovering over each state, they are able to get the information per state.
If selected, the map will take the user into a deeper look within the state, down to the county level data.
Users can also switch between the cases and vaccinated maps on this view.
Initially, we wanted to provide users an option to find vaccines within the map, but due to technical constraints and some complex issues with APIs, we decided to go in a different direction.
As we continue updating the product, we implemented an external source for users to find vaccines if they wish to do so. This leads them to the vaccine.gov website.